Publicerad den Lämna en kommentar

$24K pledged to open David Last Memorial Scholarship Fund

Photo: David Last

David Last

The Resilient Navigation and Timing (RNT) Foundation is leading a drive to establish a scholarship fund in honor of the late Professor David Last.

Professor Last was one of the first members of the foundation and had served on its International Advisory Council since its inception. He perished in the crash of a small plane he was piloting on the Nov. 25, 2019.

The foundation and three of its members have begun the drive with pledges totaling $24,000.

The fund will be administered in the United Kingdom and is envisioned to pay student expenses for attendance at navigation-related conferences and symposia.

Individuals and organizations wishing to contribute to the scholarship fund should contact the foundation at inquiries@RNTFnd.org. Donations can also be made through the foundation’s website.

Publicerad den Lämna en kommentar

The differences between Geoid18 values and NAD 83, NAVD 88 values

My last column, December 2019, highlighted the National Geodetic Survey’s (NGS) new Geoid Monitoring Service (GeMS); and, that NGS’ will be publishing a gridded geoid model GEOID2022 that will contain two components: (1) Static Geoid model of 2022 (SGEOID2022) and (2) Dynamic Geoid model of 2022 (DGEOID2022). That’s what going to happen in 2022, but what about today? Since GEOID18 has been officially released for public use, it’s time to look at differences between the Geoid18 published value and estimated geoid values computed using information from NGS’ datasheet. This column will provide an analysis of the differences between the latest published hybrid Geoid18 values provided on NGS’ Datasheet and the computed geoid height value using the published NAD 83 (2011) ellipsoid height and NAVD 88 orthometric height. This is what a user will see if they computed differences using NGS’ datasheets published values. The question will always be asked, why is there a difference between the published Geoid18 value and the computed geoid value. This column will explain some reasons for the differences.

It’s mostly good news but there are some issues that should be highlighted. This column will highlight issues on differences due to published heights that have changed since the database pull for Geoid18.

First, it should be noted that NGS’ hybrid geoid models are different than NGS’ experimental gravimetric geoid models. My December 2018 column explains these differences.

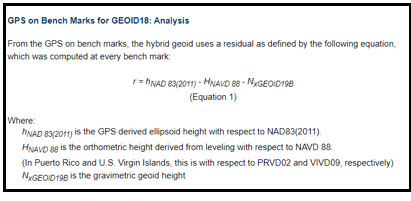
I would like to emphasize that, in my opinion, hybrid geoid models should be denoted as transformation models. Saying that, hybrid geoid models are related to “real” geoid models. Hybrid geoid model GEOID18 was computed based on NGS’ gravimetric geoid model xGeoid19b; therefore, GEOID18 is related to a gravimetric geoid model but its function is to estimate GNSS-derived orthometric heights consistent with NAVD 88 heights. As described in my previous columns, the GPS on Bench Marks (GPSBMs) data provide an estimate of the geoid height ‘N’ by differencing the ellipsoidal height ‘h’ from the orthometric height ‘H’: (N = h – H). These differences are then compared to the gravimetrically-derived geoid model. The box titled “Excerpt from Geoid18 Website Technical Details” provides a summary of the process from NGS Geoid18 web page technical details document.

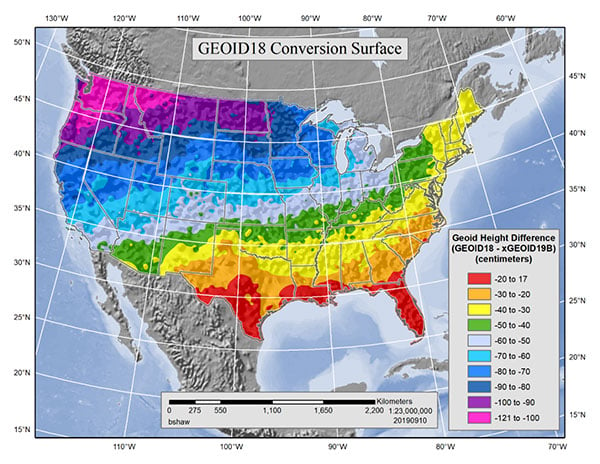
The figure in the box titled “GEOID18 Conversion Surface in cm” is the surface that represents the difference between NAVD 88 as a datum and the geopotential (geoid) surface used in the gravimetric geoid. This is the difference between the hybrid geoid and the gravimetric geoid with respect to NAD83 (GEOID18 – xGEOID19B). This surface has three essential components: a bias, a continental tilt, and local warping from the bench marks.

Excerpt from Geoid18 Website Technical Details

(https://www.ngs.noaa.gov/GEOID/GEOID18/geoid18_tech_details.shtml)

Data: National Geodetic Survey

Data: National Geodetic Survey

Hybrid Geoid Model Construction
The residuals obtained in equation 1 are contaminated with a continential tilt and bias that is estimated and removed with a simple two-dimensional planar surface. The bias-free and tilt-free residuals are ultimately used to determine a mathematical model using least squares collocation (LSC) and multiple Gaussian functions to describe the behavior seen at the bench marks. Once the relationship between the points is modeled, the model is used to generate a 1 arcminute regular grid for interpolation purposes. Figure 2 shows the final conversion surface. This surface represents the difference between NAVD 88 as a datum and the geopotential (geoid) surface used in the gravimetric geoid. This is the difference between the hybrid geoid and the gravimetric geoid with respect to NAD83 (GEOID18 – xGEOID19B). This surface has three essential components: a bias, a continental tilt, and local warping from the bench marks.

GEOID18 Conversion Surface in cm

Image: National Geodetic Survey

Image: National Geodetic Survey

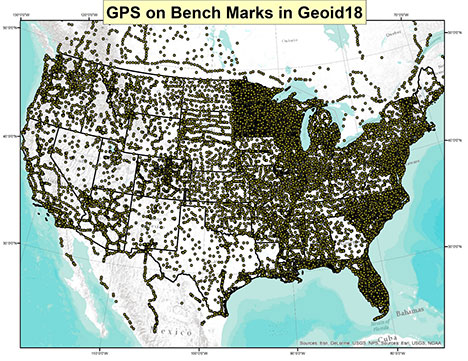
Looking at the figure in the box, the bias and tilt between the hybrid geoid model (Geoid18) and the experimental gravimetric geoid model (xGeoid19b) are fairly obvious. It’s the local warping from the bench mark data that may cause some issues to surveyors or, at least at a minimum, raise some concerned by surveyors. The box titled “Plot of the GPS on Bench Marks Involved in Geoid18” provides a plot of the GPS on Bench Marks (GPSBMs) used in the generation of Geoid18. Users can download the list of GPSBMs stations from the NGS Geoid18 website. There were 32,357 stations used to generate the model. This was an increase of approximately 6,800 stations (26%) over the hybrid geoid model Geoid12B.

Plot of the GPS on Bench Marks Involved in Geoid18

Image: National Geodetic Survey

Image: National Geodetic Survey

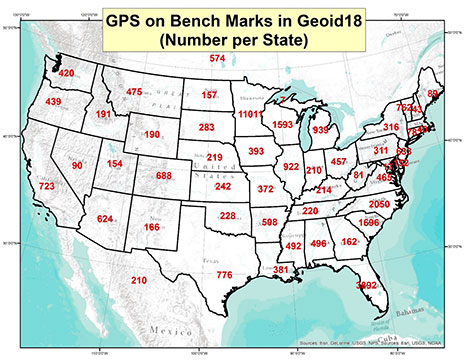
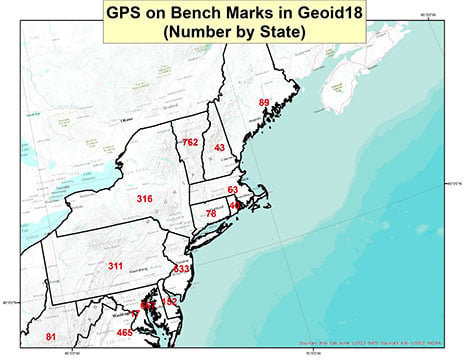
The boxes titled “Number of GPS on Bench Mark Stations by State” and “Number of GPS on Bench Mark Stations by State in Northeast U.S.” provide the number of data points per state.

Number of GPS on Bench Mark Stations by State

Image: National Geodetic Survey

Image: National Geodetic Survey

Number of GPS on Bench Mark Stations by State in Northeast U.S.

Image: National Geodetic Survey

Image: National Geodetic Survey

The box titled “Table of Number of Data Points per State” provides the number of stations per State in tabular form.

Table of Number of Data Points per State

Data: National Geodetic Survey

Data: National Geodetic Survey

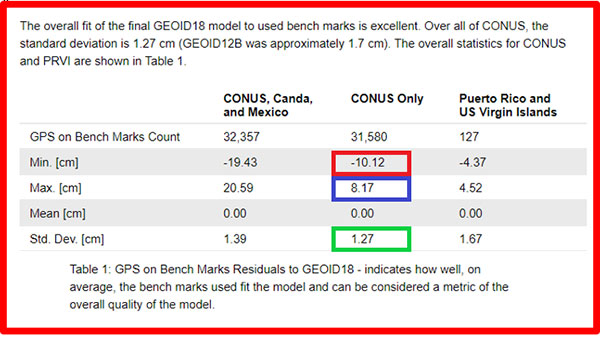
The box titled “Summary of Overall fit of Geoid18” provides a summary of the fit of residuals of Geoid18 from the NGS GEOID18 technical details document. Looking at the CONUS overall values, the standard deviation is very low 1.27 cm which is a little better than Geoid12B (1.7 cm). It should be noted that there are some large outliers (minimum value of -10.12 cm and maximum value of 8.17 cm).

Summary of Overall fit of Geoid18

(https://geodesy.noaa.gov/GEOID/GEOID18/geoid18_tech_details.shtml)

Data: National Geodetic Survey

Data: National Geodetic Survey

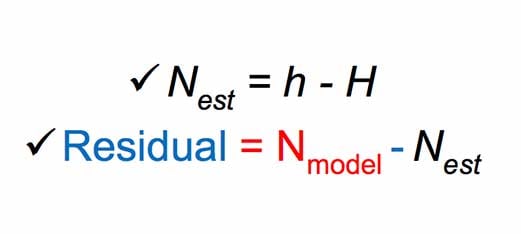
For this column, the file of bench marks provided on the NGS Geoid18 web page were combined with the published ellipsoid, orthometric, and Geoid18 heights from NGS’ datasheet. The difference between the published geoid height (Geoid18) and the estimated geoid height [published NAD 83 (2011) ellipsoid height minus NAVD 88 orthometric height] was computed using the following formula:

Data: National Geodetic Survey

Data: National Geodetic Survey

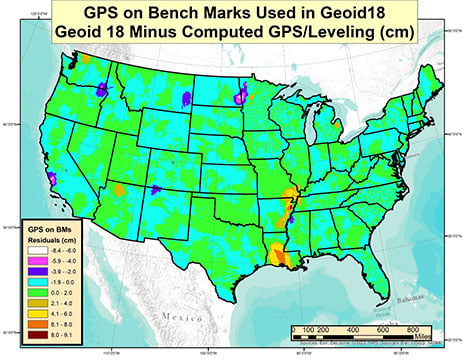
The box titled “Plot of Differences Based on GPS on Bench Marks Used in Geoid18” depicts these differences based on the stations used to generate Geoid18.

Plot of Differences Based on GPS on Bench Marks Used in Geoid18

Image: National Geodetic Survey

Image: National Geodetic Survey

Most of the values depicted on the plot are within the +/- 2 cm which is what you’d expect because the standard deviation of the overall fit is 1.4 cm. One to two centimeters is a very reasonable difference between the modeled and computed values. The question someone may ask is, I thought the model should be good to 1.4 cm so why are there large residual values on the map? There are several reasons why some of these differences are large but each case needs to be investigated to determine why they are large. This column will address one region as an example and provide a method for others to investigate differences in their area of interest.

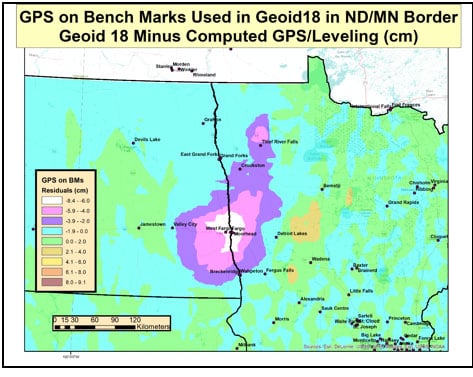
The box titled “Plot of GPS on Bench Mark Differences at the ND/MN Border” depicts a very large difference between the modeled geoid model and the estimated geoid height along the ND/MN border. As indicated in the box, the difference exceeds 6 cm.

Plot of GPS on Bench Mark Differences at the ND/MN Border

Image: National Geodetic Survey

Image: National Geodetic Survey

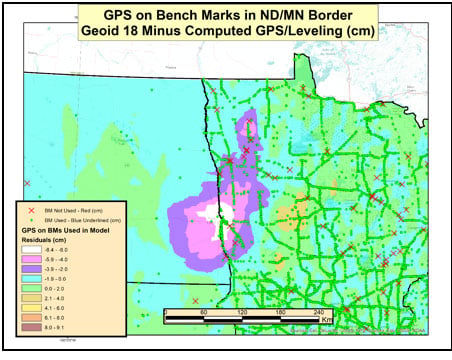
The box titled “Plot of GPS on Bench Mark Stations in the ND/MN Border Region” depict the bench marks involved in the development of Geoid18. The green circles represent the GPSBMs stations used in the creation of Geoid18 and the red “x” denote the stations that were not used in the creation of the model. As indicated in the plot, there were a lot of GPSBMs stations in the State of Minnesota (11,011).

Plot of GPS on Bench Mark Stations in the ND/MN Border Region

Image: National Geodetic Survey

Image: National Geodetic Survey

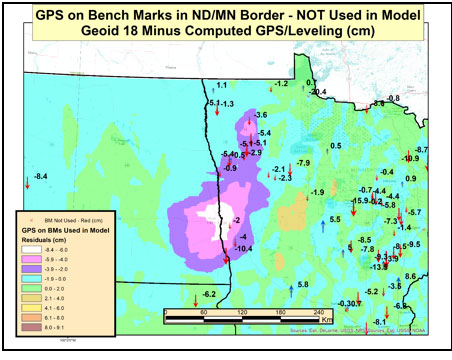
The box titled “Differences on GPS on Bench Marks in ND/MN Border — NOT Used in Model” depict the values of the rejected GPS on BMs stations. These stations were not used to create the hybrid geoid model Geoid18. As the plot indicates there are several large differences. This is not really surprising since these stations were not used in the model.

Differences on GPS on Bench Marks in ND/MN Border — NOT Used in Model

Image: National Geodetic Survey

Image: National Geodetic Survey

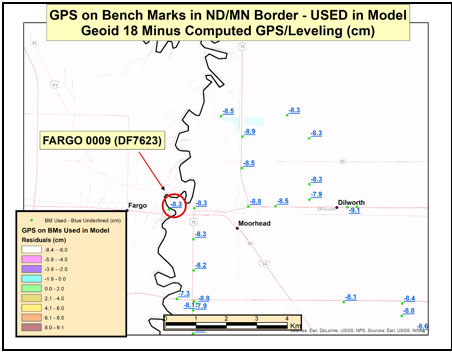
The box titled “Differences on GPS on Bench Marks in ND/MN Border — USED in Model” depict the values of the GPS on BMs stations used to create the Geoid18 model. Some of these differences exceed 8 cm. You would expect these differences to be small since these stations were used to create the model. So, why are there large post-modeled residuals in the Fargo, ND, region of the United States?

Differences on GPS on Bench Marks in ND/MN Border – USED in Model

Image: National Geodetic Survey

Image: National Geodetic Survey

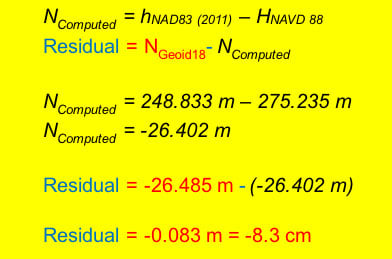
In August 2019, NGS performed a large leveling network adjustment in the Minnesota. The adjustment was performed after the Geoid18 database pull. The adjustment resulted in a 7- to 9-cm bias between the published height values and the superseded values. The August 2019 Minnesota leveling network adjustment heights were not used in the creation of Geoid18. The post-modeled differences presented in this column were generated using the published NAD 83 (2011) ellipsoid heights and current NAVD 88 orthometric heights from the NGSIDB. It was determined by NGS that the differences in the Fargo region were mostly due to crustal movement. Therefore, since the differences were due to movement, secondary adjustments will need to be performed to feather the 7- to 9-cm differences to maintain consistency between published NAVD 88 heights in the region. The secondary adjustments have not been completed as of the publication of this column so the residuals west of Fargo in North Dakota are small. These values will change after the secondary adjustment is completed and loaded into NGS’ database.

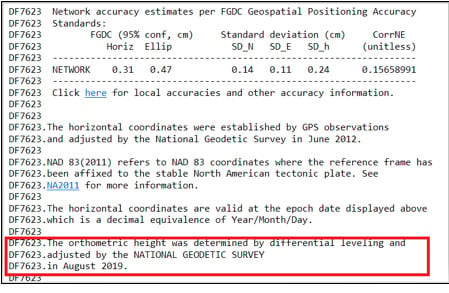
As an example, I’ve highlighted the station Fargo 0009 (PID DF7623) in the area of Fargo, North Dakota (see box titled “Differences on GPS on Bench Marks Near Fargo, ND”). The difference (-8.3 cm) is between the published Geoid18 value and the computed geoid value using the published ellipsoid height and orthometric height from the NGS’ datasheet. The box titled “Excerpt from Datasheet for Station Fargo 0009 (DF7623)” provides the information from NGS datasheet for station Fargo 0009; the information used in the computations are highlighted in the box. The box titled “Computation of the Difference between the Modeled Geoid Value (Geoid18) and the Computed Geoid Value for Fargo 0009” provides the process used to compute all differences for this column.

Differences on GPS on Bench Marks Near Fargo, North Dakota

Image: National Geodetic Survey

Image: National Geodetic Survey

Excerpt from Datasheet for Station Fargo 0009 (DF7623)

Data: National Geodetic Survey

Data: National Geodetic Survey

Data: National Geodetic Survey

Data: National Geodetic Survey

Data: National Geodetic Survey

Data: National Geodetic Survey

Computation of the Difference between the Modeled Geoid Value (Geoid18) and the Computed Geoid Value for Fargo 0009
(Information from NGS Published Datasheet)

Data: National Geodetic Survey

Data: National Geodetic Survey

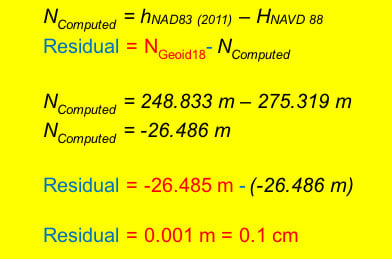
So, why is this difference so large in this region? A stated above, NGS performed a readjustment in this region and superseded the heights that were used in the creation of the Geoid18 hybrid model. The Geoid18 hybrid model used the previously published orthometric heights, now provided in the superseded section of the NGS datasheet, because that was the current published height at the time of the data pull for the Geoid18 process. Therefore, if we substitute the superseded height from the datasheet into the equation the difference is reduced to 0.1 cm (1 mm). [See the box titled “Computation of the Difference between the modeled geoid value (Geoid18) and the computed geoid value for Fargo 0009 Using the Superseded NAVD 88 Value.”]

Computation of the Difference between the modeled geoid value (Geoid18) and the computed geoid value for Fargo 0009 Using the Superseded NAVD 88 Value
(Information from NGS Published Datasheet)

Data: National Geodetic Survey

Data: National Geodetic Survey

This means if someone uses NGS’ OPUS web tool to compute a GNSS-derived orthometric height, the NAVD 88 GNSS-derived orthometric height will be about 8 cm different than the published stations in this region. This should not be an issue if the users follow published NGS Guidelines to estimate the NAVD 88 GNSS-derived orthometric height, and/or uses NGS Beta OPUS-Projects and NGS procedures to estimate the NAVD 88 GNSS-derived orthometric height. These processes will ensure that the height will be consistent with the current published NAVD 88 orthometric heights in the NGS database.

The technical report on Geoid18 provides a good explanation on the stations used in the United States Gulf Coast region. See box titled “GPS on Bench Marks for GEOID18 in the Gulf Coast Region.”

GPS on Bench Marks for GEOID18 in the Gulf Coast Region

(https://www.ngs.noaa.gov/GEOID/GEOID18/geoid18_tech_details.shtml)

There are areas of complex vertical crustal motion in the Texas/Louisiana Gulf Coast region of the United States which render many control station elevations in the region invalid. The selection of GPS on Bench Marks in this region was limited to the small number of marks where the leveling and GPS data agreed to minimize the influence of crustal motion in the hybrid geoid model. Figure 1 depicts the selection of stations used in the hybrid geoid model along the Texas/Louisiana Gulf Coast.

Image: National Geodetic Survey

Figure 1: GEOID18 Gulf Coast selected marks. (Image: National Geodetic Survey)

As indicated in the box titled “GPS on Bench Marks for GEOID18 in the Gulf Coast Region” very few stations in Southern Louisiana were used in the creation of the hybrid geoid model. The box titled “Differences on GPS on Bench Marks in the Gulf Coast Region” depict the differences between the published Geoid18 value and the computed geoid value using the latest NAD 83 (2011) ellipsoid and NAVD 88 orthometric height. The plot indicates that there are many large differences. This is to be expected because the orthometric heights used in the creation of the hybrid geoid model are all superseded heights. This is because the only published heights in Southern Louisiana are GNSS-derived orthometric heights and leveling-derived orthometric heights were used in the creation of GEOID18.

Differences on GPS on Bench Marks
in the Gulf Coast Region

Image: National Geodetic Survey

Image: National Geodetic Survey

Saying that, NGS performed a large GNSS network project in Southern Louisiana in 2016. At the time of the writing of this column, the GNSS-derived orthometric height from the 2016 project were not yet finalized.

This column provided an analysis of the differences between the latest published hybrid Geoid18 values provided on NGS’ Datasheet and the computed geoid height value using the published NAD 83 (2011) ellipsoid height and NAVD 88 orthometric height. The column highlighted issues on differences due to published heights that have changed since the database pull for Geoid18. Future columns will address differences in other portions of CONUS.

Publicerad den Lämna en kommentar

Seen & Heard: Karma drone down, GLONASS guides missiles

“Seen & Heard” is a monthly feature of GPS World magazine, traveling the world to capture interesting and unusual news stories involving the GNSS/PNT industry.


Photo: Karma drone/GoPro

Photo: Karma drone/GoPro

Bad karma

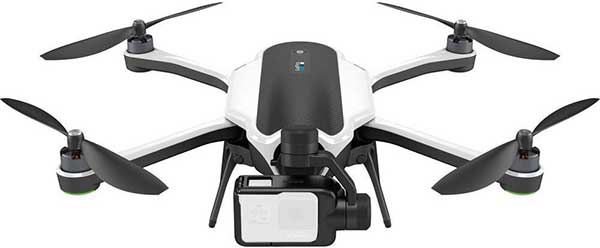
The GoPro Karma drone has been grounded since the new year began, reports The Verge. Multiple owners say their Karma controllers are flashing errors about not receiving a GPS signal, and that they can’t calibrate the compass. They’re not able to fly the drones even after disabling GPS. A GoPro spokesperson told The Verge that it is “actively troubleshooting” the issue.


Photo: Casino/Borgata Hotel & Casino

Photo: Casino/Borgata Hotel & Casino

Going wild at the casino

A Waze ad in January misdirected drivers headed to Atlantic City’s Borgata Hotel Casino & Spa into New Jersey’s Pine Barrens. Jackson Township police helped numerous motorists stuck on unpaved roads about 45 miles from the casino, which is just off the Atlantic City Expressway. The address on the ad was correct, but the location pinned with the ad is actually in the Colliers Mills wildlife area.


Photo: Rock penguins/Charles Bergman/Shutterstock.com

Photo: Rock penguins/Charles Bergman/Shutterstock.com

Feed the birds, not the mice

Irish structural engineer John Houston used a Trimble R10 GNSS receiver and Centerpoint RTX to help mitigate a serious threat to Gough Island’s birds. The Royal Society for the Protection of Birds seeks to eradicate invasive mice left from 19th-century ships. The survey will help locate temporary infrastructure for workers to distribute poisoned bait to kill the voracious rodents, which feed on two million defenseless eggs and chicks each year. Though 1,000 kilometers from the nearest reference station, Houston achieved centimeter accuracy on all survey points. See the monster mice here.


Photo: U.S. Marines at Al Asad Air Base in 2018. (Cpl. Jered T. Stone/Marine Corps)

Photo: U.S. Marines at Al Asad Air Base in 2018. (Cpl. Jered T. Stone/Marine Corps)

Missiles guided by GLONASS

According to Israeli military intelligence website DEBKAfile, Russia gave Iran access to GLONASS to target the U.S. base in Iraq on Jan. 8. The strike injured 34 American soldiers. DEBKAfile reports that Russia-provided GLONASS access allowed Iranian missiles to hit with an accuracy of 10 meters at the Ain Assad base in western Iraq. “According to Russian sources, 19 missiles were fired from the territory of Iran, 17 of which hit the targets,” DEBKAfile said.

Publicerad den Lämna en kommentar

Maintaining the 1-dB standard

How do we ensure that GPS is protected from harmful interference?

By J. David Grossman, guest columnist

J. David Grossman

J. David Grossman

Debates in Washington over harmful interference and the coexistence of divergent services are raging. Nowhere are the differences more apparent than when comparing radio navigation services such as GPS to radio communications systems used in wireless communications networks.

How do we ensure that a satellite-based radionavigation service like GPS, which by design operates below the ambient noise floor, is protected from harmful interference? The International Telecommunications Union’s (ITU) definition of harmful interference provides a starting point, by defining harmful interference as a level that “endangers the functioning of a radionavigation service.”

With this foundational definition, the internationally established criterion of a 1-decibel (dB) increase in the noise floor, otherwise known as the 1-dB standard, provides the answer, offering a readily identifiable, objective and predictable metric.

The 1-dB standard uses a 1-dB increase in the noise floor as the distinction between the onset of interference that can be detected by a GPS receiver and harmful interference. (This can be reliably measured by a 1-dB decrease in the carrier-to-noise ratio, C/N0, reported by the receiver). Thus, the 1-dB standard provides a definitive way to protect GPS receivers from harmful interference. Adherence to this standard helps ensure that systems operating in an adjacent spectrum band do not interfere with GPS.

Why use the 1-dB standard instead of other metrics? The 1-dB standard is based upon well-understood GNSS engineering considerations and is associated with quantifiable changes in the overall noise to which GNSS receivers are subject, with equally well-understood effects on receiver operation. (The 1-dB standard enables system designers and spectrum regulators to carefully assess interference from various sources and analyze their net effect on GNSS receivers).

It also has been adopted internationally and has a long and well-established proven history of protecting GPS operations from harmful interference in both international and domestic regulatory proceedings.

So-called “alternatives” to 1 dB, which may be appropriate in the context of radio communications systems, fail to recognize that the accuracy, integrity and reception (availability) of GPS signals used by a receiver can be degraded by interfering noise in ways not immediately apparent to an end user. This means that the effects of degraded service of GPS signals can still be detrimental well before the user loses position accuracy or experiences complete loss of position.

Additionally, C/N0 is computed at the entry point of a GPS receiver, such that a 1-dB decrease serves as an early warning of interference potentially becoming harmful. Other metrics, computed further downstream, may be indicative of harmful interference already occurring.

GPS has become a fundamental part of our lives and is an integral engine of the U.S. economy, creating new jobs, and unlocking innovation. Maintaining the 1-dB standard ensures that the GPS success story and American innovation will continue for decades to come.


J. David Grossman is executive director of the GPS Innovation Alliance.

Publicerad den Lämna en kommentar

E-Compass offers GNSS + inertial receiver

Photo: E-Compass

Photo: E-Compass

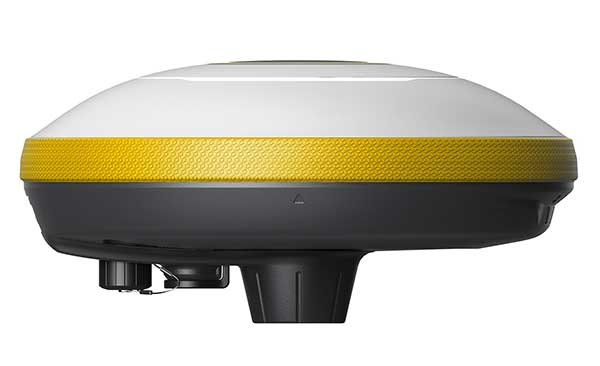
E-Compass Science & Technology (also known as e-Survey) is offering a new dynamic GNSS receiver, the E300 Pro.

The interface adopts a concealed design for better protection, and USB type-C charging and transmitting is a two-in-one function.

The magnesium-alloy body is rugged and the battery level can be checked with a unique LED power indicator.  The weight of the whole receiver is 940 grams.

The E300 Pro supports satellite station differential and satellite chain life, quick connection, intelligent voice, and  tilt compensation. The E300 Pro tracks GNSS with 700 channels and fully supports BDS-3 signals. It supports 31 frequency points, using all GNSS satellite systems and frequency bands.

Inertial integration. The E300 Pro integrates multiple sensors including GNSS, an inertial measurement unit (IMU) , a magnetometer and a  thermometer. With the help of a Kalman filter algorithm, the device can dynamically output position, speed and attitude information. It can measure and make real-time dynamic sampling without the need for leveling.

Combined GNSS Antenna. For better radio signal quality, the E300 Pro integrates GNSS, Bluetooth, Wi-Fi, 4G main and auxiliary antennas on the top of the receiver to ensure the best reception in all directions. An innovative RF connector greatly improves connection reliability, while reducing loss of gain.

Founded in 2005, e-Compass provides data acquisition and positioning equipment including high-precision GNSS receivers, GIS data collectors and combined inertial navigation products.The company is based in Shanghai, China, with offices in the United Kingdom and Hong Kong.

Publicerad den Lämna en kommentar

Testbed enables infrastructure for autonomy, smart cities

Rooftop view of the central parts of Aarhus with the harbor area and the sea in the background. (Photo: DTU Space)

Rooftop view of the central parts of Aarhus with the harbor area and the sea in the background. (Photo: DTU Space)

A testbed in an active urban center can show real-world effects on GNSS as an aid for developing autonomous systems for green mobility, smart-city applications or transportation, to name a few.

Sited in Denmark, the 600-square-kilometer Testbed in Aarhus for Precision Positioning and Autonomous Systems (TAPAS) covers both a densely populated city center and suburbs, a large industrial harbor and parts of Aarhus Bay. Aarhus is the second largest city in Denmark with a population of 350,000 people.
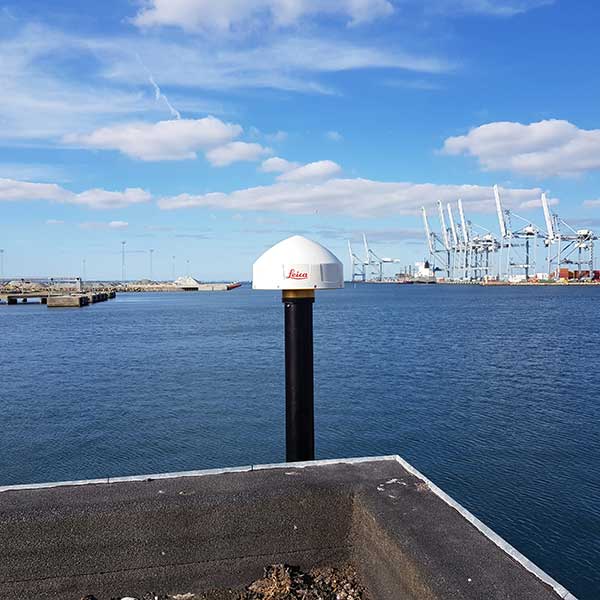
The GNSS antenna at TAPAS station TA01. (Photo: DTU Space)

The GNSS antenna at TAPAS station TA01. (Photo: DTU Space)

Based on RTK methodology, TAPAS is a sound ground-based testbed to support, test and validate technological developments with a need for fast, efficient, flexible and reliable precision positioning. It is designed as a geodetic innovation platform, with both physical and virtual networks providing positioning to the centimeter (cm) level.

Autonomous systems within transportation, agriculture and environmental monitoring constitute a large growth area for businesses and governments. Automated vehicles, drones and vessels are linked closely to geodetic infrastructure and communications networks such as 5G. TAPAS provides developers in these fields with opportunities to observe GNSS in urban canyons and under canopies, as well as challenges for coastal marine applications. The testbed is available for third-party research projects, and testing of ideas, initiatives and concrete prototypes.

TAPAS is fully funded and owned by the Danish Agency for Data Supply and Efficiency (SDFE), the Danish agency for geodesy and geographical data. TAPAS is developed by the National Space Institute at the Technical University of Denmark (DTU Space), and is supported by the city of Aarhus. The TAPAS testbed was established partly because of Denmark’s National Space Strategy, which points to the new technological development within positioning, as well as possibilities for use of Galileo, the European GNSS, to the benefit of as many citizens as possible.

In this article, we review the TAPAS testbed, including design and installation of the GNSS reference stations and the data-processing center, as well as initial performance testing carried out by DTU Space.

Network of GNSS Reference Stations

The network of TAPAS stations in and around the city of Aarhus in Denmark. (Map: DTU Space)

The network of TAPAS stations in and around the city of Aarhus in Denmark. (Map: DTU Space)

The basic component of TAPAS is high-accuracy carrier-phase-based GNSS positioning using the network RTK methodology, which can provide real-time position accuracies for the end user down to the cm level.Essentially, TAPAS is based on a network of 11 GNSS reference stations as well as data communication infrastructure, a central processing facility with a data server, processing software and data storage.

TAPAS was designed to provide real-time position uncertainties for objects in motion within 1 cm in three dimensions (1 cubic cm), for end users with modern GNSS equipment. A dense network of GNSS reference stations was originally designed with stations 5 km apart in the city center and up to 10 km apart in the suburbs.

Because suitable locations had to be found, in the final network distances range from 4.1 km to 22.3 km, with the longest distances across the water to station TA04 (see the network plot in the graphic above).
Stations TA01, TA03, TA05, TA06 and TA08 are in the city center. Stations TA02 and TA04 are across Aarhus Bay, ensuring coverage for marine applications and contributing to more robust positioning near the sea and in the harbor area around station TA01.

TAPAS Stations

The TAPAS GNSS reference stations are equipped with the newest generation of GNSS receivers and antennas capable of tracking all available signals from the GPS, GLONASS, Galileo and BeiDou systems. The stations also have an antenna splitter, power supply, fuse box, programmable logic controller (PLC) for monitoring and control, trustgate, modem and uninterruptible power supply with battery pack (Figure 1). All units were integrated in the cabinets and tested in the lab before installation The stations are modular and flexible for future iterations and updates.

The receivers can be accessed remotely via a VPN line to a web interface for monitoring, changing settings or firmware updates. All TAPAS stations transmit data to servers at DTU Space where the data is used for estimation of RTK corrections. Also, data is transmitted to servers at the SDFE for storage and backup (Figure 1).
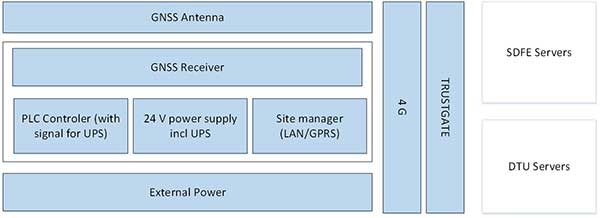
Figure 1. Design schematics of the TAPAS stations. (Image: DTU Space)

Figure 1. Design schematics of the TAPAS stations. (Image: DTU Space)

After installation in the fall of 2018, GNSS data quality was verified for each station by estimating preliminary positions and analyzing data quality. Also, signal strength as given by the carrier to noise ratio (C/N0) of the received signals was analyzed and plotted with 24 hours of data from each of the stations (Figure 2).

Figure 2. Skyplot of C/N0 values of the L1/E1 signal of the GPS, GLONASS and Galileo constellations plotted for one full day of data from TAPAS station TA11. (Image: DTU Space)

Figure 2. Skyplot of C/N0 values of the L1/E1 signal of the GPS, GLONASS and Galileo constellations plotted for one full day of data from TAPAS station TA11. (Image: DTU Space)

Network Real-Time Kinematic (RTK)

Data from the TAPAS stations streams in real time to the Central Processing Facility (CPF) operated at a dedicated server at DTU Space in Lyngby, North of Copenhagen. The GNSS observations are processed using the GNSMART 2 software from Geo++, where corrections for network RTK positioning are estimated. The corrections are estimates for errors affecting the GNSS positioning, such as inaccuracies in satellite positions and clock drift parameters as well as ionospheric and tropospheric effects. The dense network of reference stations in TAPAS will assure that corrections for the atmospheric effects will be of very high quality.

For estimation of the RTK corrections, standard software settings are used. All corrections are estimated by a state space representation (SSR) technique, where error sources are modeled individually. This means TAPAS can deliver both RTK corrections and corrections for precise point positioning (PPP).

TAPAS corrections are generated in the RTCM format and output using the NTRIP protocol. Registered users can access the corrections through the internet via an NTRIP caster. On the user side, the TAPAS corrections are applied in the positioning process of a GNSS receiver. To make full use of the TAPAS data, user equipment should be capable of tracking carrier-phase-based GNSS data and applying the TAPAS correction data supplied in the RTCM version 3.x format.

An example of a use of TAPAS is provided in the photo in Figure 9 below where the authors of this article tested the position accuracy of TAPAS for a typical land surveying task, using a Septentrio Altus APS3G receiver with an allegro2 controller unit for RTK positioning. The user’s GNSS equipment can, however, be many other different types and makes of GNSS antennas and receivers, and the equipment can be installed on many different platforms for instance in vehicles, on drones, in robots etc.

Geodetic Basis

When determining positions with uncertainties at the 1-cm level, it is important to be aware of the geodetic reference frame used for the positioning. In this case, coordinates for the TAPAS stations have been estimated by DTU Space, using Bernese GNSS software, in the national Danish reference frame which is a realization of the European Terrestrial Reference System (ETRS).

When applying corrections from the TAPAS caster in the positioning calculations at the user side, positions will be obtained within the same reference frame (coordinate system). In this case, where the national geodetic reference frame is used, this means that the user will obtain positions compliant with maps, charts and other types of geodata geo-referenced in the same coordinate system.

For 3D positioning, the Danish geoid model must be applied on the user side to obtain heights relative to mean sea level in the national Danish Vertical Reference (DVR90).

It is possible to configure the setup of the central processing facility using another reference frame for TAPAS given that precise coordinates for the TAPAS stations can be provided in the given reference frame. Future work with TAPAS can involve the use of dynamic geodetic reference frames and transmission of coordinate transformation parameters to the users.

Performance Testing

After the stations were installed, DTU Space conducted performance testing, including testing data communication between the TAPAS stations and the TAPAS server, analyses of data completeness from the TAPAS stations, and field tests carried out after the network RTK processing had become sufficiently stable.

Performance test in static mode. In February 2019, a static mode test took place in a park-like area within the three innermost stations. Two different high-accuracy survey-grade RTK-receivers were used for the field test. RTK positions were estimated at 1 Hz for 30 minutes. For each minute, an average position was calculated based on the 60 observations, and for each of the minute-bins the standard deviation with respect to the reference position was computed.
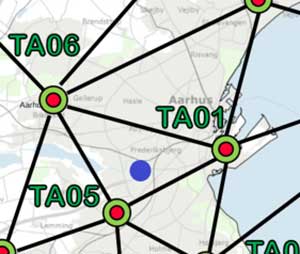
Test location indicated with purple circle in the network plot. (Image: DTU Space)

Test location indicated with purple circle in the network plot. (Image: DTU Space)

Altus APS3G unit mounted at the test location. (Photo: DTU Space)

Altus APS3G unit mounted at the test location. (Photo: DTU Space)

The results are shown in the plots below, where standard deviations are provided for each epoch (i.e., for each bin of 60 seconds).
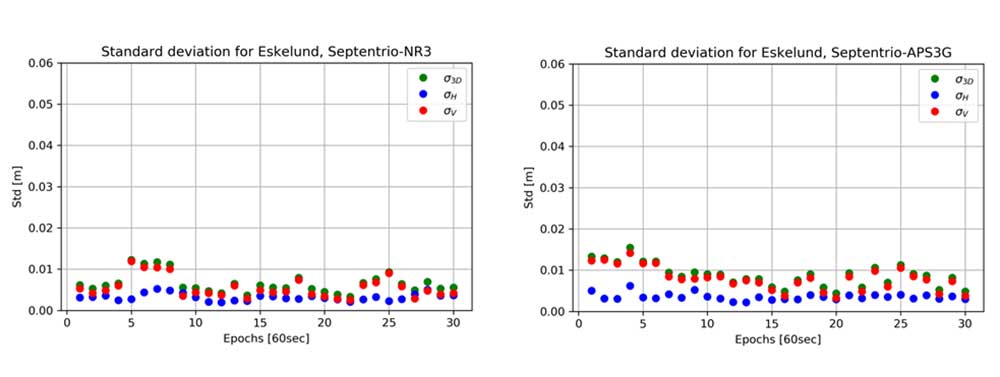
Standard deviation in meter for each 60 second with GNSS receiver Altus NR3 (left) and Altus APS3G (right). Results provided in meter. (Images: DTU Space)

Standard deviation in meter for each 60 second with GNSS receiver Altus NR3 (left) and Altus APS3G (right). Results provided in meter. (Images: DTU Space)

In the plots, results are provided for the vertical (red), the horizontal (blue) and the 3D position (green). Results of using the two different receivers are comparable, and focusing on the 3D solutions the largest standard deviation is 1.6 cm which is for the fourth epoch with receiver APS3G. Most of the 3D results shown in the plots are better than 1 cm.

The same test was carried out using a dual-frequency non-survey-grade receiver developed for machine control and autonomous vehicle applications. This receiver was connected to the same antenna mounted on a tripod. Results of using this receiver in static mode are shown in the plot below. In this case, the 3D results are all better than 3.1 cm, and many of the 3D results are better than 1 cm in this open test area.
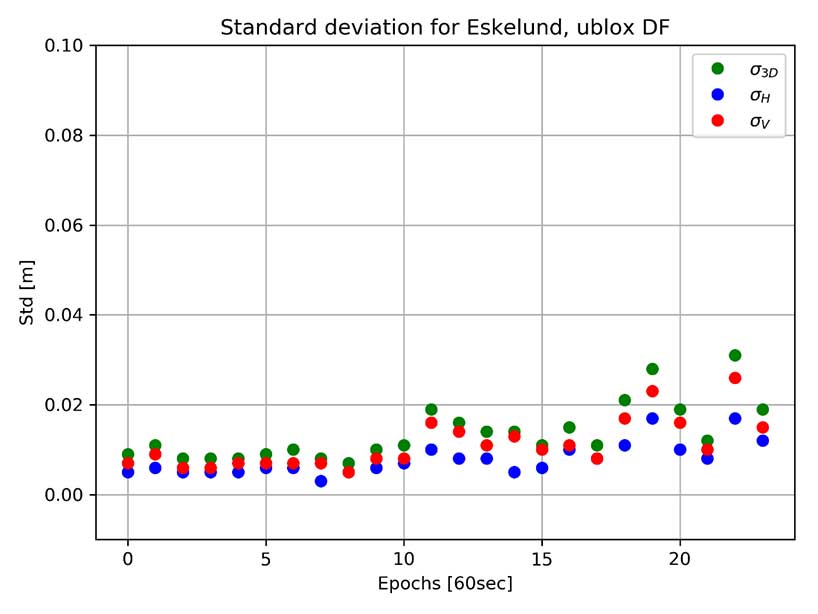
Standard deviation for each 60 second with GNSS receiver u-blox F9P dual frequency (DF). Results provided in meter. (Image: DTU Space)

Standard deviation for each 60 second with GNSS receiver u-blox F9P dual frequency (DF). Results provided in meter. (Image: DTU Space)

Performance test in kinematic mode. In the same area used for the static test, a kinematic test was carried out with the same three receivers.

The test was performed using a camera dolly and by placing approximately 10 m of rail on the ground. The camera dolly was pulled back and forth along the rail, a setup that provided a stable trajectory for testing positioning performance while the GNSS antennas were moved slowly and smoothly. A rigid bench, where the GNSS antennas could be mounted, was constructed and installed on the dolly. The three GNSS receivers with antennas were mounted on the bench, and the dolly was pulled back and forth along the tracks 10 times.
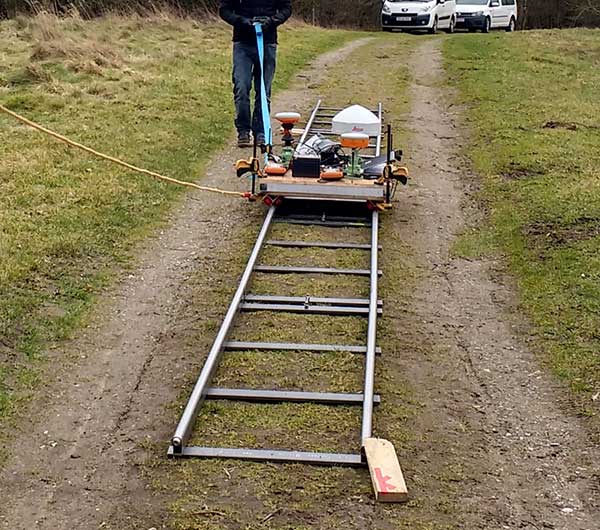
Kinematic Test: Camera dolly with GNSS equipment pulled along tracks. (Photo: DTU Space)

Kinematic Test: Camera dolly with GNSS equipment pulled along tracks. (Photo: DTU Space)

For each 1-meter section of track, the standard deviation of the differences with respect to the reference trajectory of the 10 repetitions was calculated. Results for the two survey-grade receivers are shown in the plots in Figure 3. All of the 3D standard deviations are better than 1 cm for both survey-grade receivers.
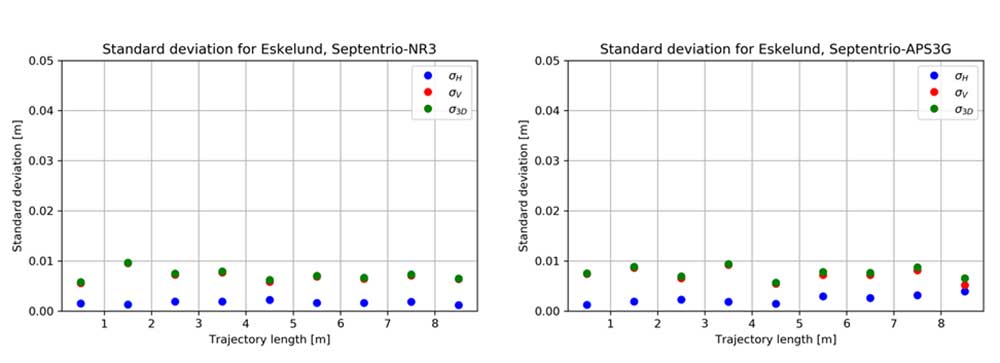
Figure 3. Kinematic test results are provided for the vertical (red), horizontal (blue) and 3D (green) positions. (Image: DTU Space)

Figure 3. Kinematic test results are provided for the vertical (red), horizontal (blue) and 3D (green) positions. (Image: DTU Space)

The non-survey-grade dual-frequency receiver also was mounted on the test bench, and the results of using this receiver are shown in the plot below. With this receiver, the 3D results are below 2.1 cm for all sections of the trajectory, except for the first meter, a deviation that may have been caused by issues with initialization of the test.
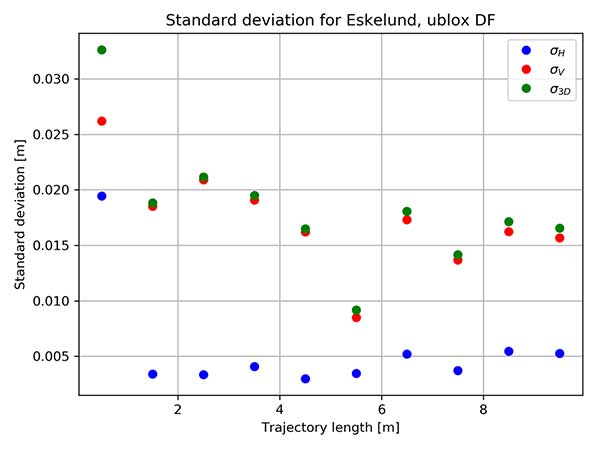
Binned standard deviation of 10 repetitions with GNSS receiver u-blox F9P dual frequency (DF). Results provided in meter. (Image: DTU Space)

Binned standard deviation of 10 repetitions with GNSS receiver u-blox F9P dual frequency (DF). Results provided in meter. (Image: DTU Space)

These tests show that it is possible when using TAPAS to obtain position solutions at the cm-level in open areas in both static and kinematic mode.

Performance test in dynamic mode. In November 2019, DTU Space carried out a performance test of TAPAS in dynamic mode, using a car with roof-mounted GNSS equipment. The car was driven within the TAPAS coverage area, passing through urban canyons, open streets and the harbor area. During the test, the car drove in normal Aarhus traffic, at speeds varying from zero at traffic lights up to 60 km/h on the wider roads leading into the city center.

Four different receivers were strapped in the car and connected to either a small patch antenna or a survey-grade antenna mounted on the roof. A survey-grade receiver was mounted on the roof.
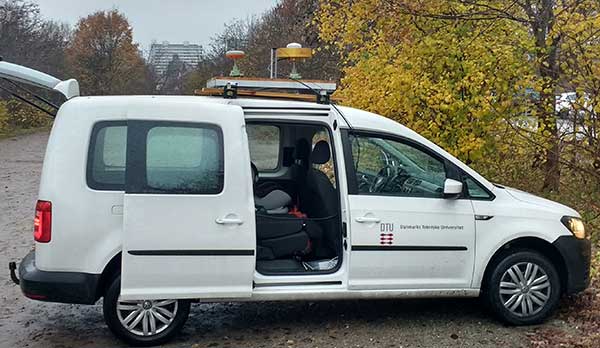
Three different GNSS antennas mounted on the roof of the car used for dynamic testing. (Photo: DTU Space)

Three different GNSS antennas mounted on the roof of the car used for dynamic testing. (Photo: DTU Space)

Data from the receiver was converted to KML files, which can be used with Google Earth to illustrate the quality of the positioning obtained during the drives through the city. The plot in Figure 4 shows the quality of the position solution. The best quality is obtained when the ambiguities are fixed, such as an RTK fixed solution at the cm level (green). The second-best quality is with ambiguities estimated to float values, such as an RTK float solution at the dm level (purple). Orange shows differential position solutions at the meter level when corrections for the carrier-phase data have not been obtained. Finally, a few positions were stand-alone GNSS solutions when no aiding from TAPAS was applied in the roving GNSS receiver (blue).
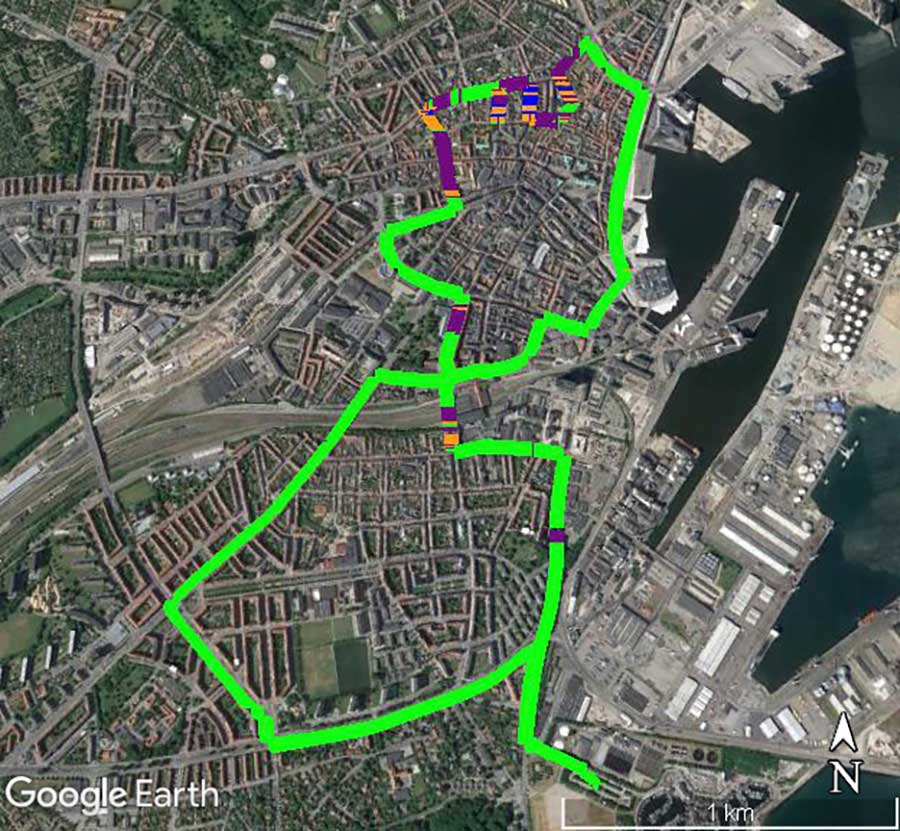
Figure 4. Quality of RTK positions obtained during one drive through the City of Aarhus. (Map data: Google, TerraMetrics)Photo:

Figure 4. Quality of RTK positions obtained during one drive through the City of Aarhus. (Map data: Google, TerraMetrics)Photo:

The plot clearly shows, as expected, that the quality of the positions determined by the survey-grade receiver in the car is good most of the time. But it suffers in areas with narrow streets aligned with buildings or trees.

These results do not tell the actual uncertainty of the position solutions. But GNSS carrier-phase data collected with one of the receivers in the car during the drive will be post processed to serve as a reference trajectory. Upcoming analyses of the data will then reveal the uncertainty of the positions determined in real time as compared to the post-processed reference trajectory.

Test Conclusion. After the field tests, we conclude that the TAPAS testbed is able to provide correction data that makes it possible to perform GNSS-based positioning in real time in both static and dynamic mode with position uncertainties at the cm-level. Further, as we analyze the test data thoroughly, TAPAS will be able to set a tone for new research. For instance, the plot in Figure 4 provides a foundation for testing assistance procedures to gain better coverage in the most densely built areas. In this way, TAPAS will aid research into feasible infrastructure for the technologies of tomorrow, such as autonomous driving.

Outlook and Future Work

Because TAPAS is not commercial, it is possible, upon agreement with the SDFE, to make changes to the system to adapt to specific testing or development needs. Examples are removing data from some stations in the estimation of RTK correction data, installing an extra receiver in one or more stations using the antenna splitters, or making changes to the settings in data processing on the TAPAS server for shorter time intervals.

At DTU Space, plans for the testbed include further development of software for ionosphere and integrity monitoring. The station receivers can estimate total electron content (TEC) along the GNSS signal path in Earth’s atmosphere, as well as indices for ionospheric scintillation. DTU Space is researching using this output for an ionosphere monitoring service and to develop it into an integrity monitoring service for GNSS users.

Upcoming additions to the RTCM data format will support more advanced modeling of the effects of the ionosphere and troposphere, and this will allow for full benefit of the TAPAS SSR network corrections. Research on such models to be applied on the server side, as well as on the user side, will be carried out by DTU Space and tested with TAPAS as a contribution towards the integration, or hybridising, of PPP and RTK. This is also referred to as PPP-RTK positioning which is expected to be especially useful for mass market applications such as autonomous driving. When implemented in TAPAS, such solution may effectively increase the number of simultaneous users as well as use-cases for TAPAS.

TAPAS provides many opportunities for testing precision or high-accuracy applications, such as autonomous vehicles, vessels, drones and robots; location-based services requiring high accuracy on various digital platforms; and solutions for a more digitized and intelligent city environment through smart-city and green mobility initiatives.

TAPAS is prepared for the implementation of the coming 5G technologies, and station intercommunication capabilities enable testing of internet of things (IoT) technologies where precision positioning is part of the development. The testbed also provides an excellent environment for validation of new services such as the Galileo High Accuracy Service (HAS). Another area in which TAPAS can play an important role is verification and validation of future 5G-based positioning services.

For more on TAPAS, visit www.tapasweb.dk/english.

Acknowledgments

The TAPAS testbed was developed with close cooperation between DTU Space and SDFE. SDFE contributors include Kristian Keller, Casper Jepsen, Henrik Olsen, Martin Skjold Grøntved, Brigitte Rosenkranz, Maria Rask Mylius and Søren Fauerholm Christensen. DTU Space contributers include Ole Bjerregaard Hansen, Finn Bo Madsen, Lars Stenseng, Daniel Haugård Olesen, Stefan Emil Steffensen, Thor Heine Snedker, Per Knudsen and Niels Andersen.

Manufacturers

The GNSS receivers at the TAPAS stations are Septentrio PolaRx5S, and the antennas are Leica AR20. For field testing, a Septentrio Altus NR3 receiver, a Septentrio Altus APS3G receiver and a u-blox ZED F9P dual-frequency receiver were used. The TAPAS station cabinets were assembled and mounted by Nordtec-Optomatic A/S. The TAPAS testbed software solution is based on the GNSMART 2 software package from Geo++ GmbH. Data analyses and processing has been carried out using the Septentrio SBF Analyser and SBF Converter, the RTKlib and the Bernese GNSS software.


Anna B. O. Jensen is senior advisor and team lead of the GNSS group at DTU Space in Denmark. She is also a part-time professor at KTH Royal Institute of Technology in Sweden.

Per Lundahl Thomsen is a chief consultant at DTU Space. He has many years of experience with management of space technology projects and is project manager for the TAPAS testbed.

Søren Skaarup Larsen is a Ph.D. student at DTU Space. Along with his GNSS studies, he runs the RTK-part of the TAPAS testbed.

Publicerad den Lämna en kommentar

Big acquisition: Quorvo to acquire location company Decawave

logos-Decawave

Decawave announced today that Qorvo, a provider of RF solutions, is acquiring the company, as well as Custom MMIC. Financial details have not been disclosed.

“This acquisition is by far the biggest in the indoor location industry,” according to Bruce Krulwich, founder of Grizzly Analytics. “While the price is not disclosed, I and others have estimated it at $400-500 million.”

“Apple is using their own UWB chips in upcoming iPhones, but their own chips are too big and use too much power to be used in smartwatches or other small devices,” Krulwich said. “Decawave’s chips will enable Qurvo to sell compatible UWB chips to a much wider range of markets.Apple’s use of UWB in iPhones is the tipping point for UWB. With Apple’s stamp of approval, UWB will be incorporated into a wide range of location-aware electronics, including robots, drones, wearables, smartwatches and more.”

“The biggest implications for this acquisition are not only in the RTLS market, but also in the areas of internet of things, wearables and location-aware electronics,” Krulwich said. “UWB is being used in next-generation products like drones by Intel, robots by iRobot, and autonomous vehicle movement by Segway.”

Bob Bruggeworth, president and chief executive officer of Qorvo, said in a third-quarter financial release that the company was “looking forward to welcoming two industry-leading teams, Decawave and Custom MMIC, to the Qorvo family, expanding our technology portfolio and product offerings.”

Decawave is an Irish fabless semiconductor company specializing in precise location and connectivity applications. The acquisition will advance market penetration of IR-UWB and enable broad global adoption of the technology.

Decawave was founded in Dublin in 2007 by current CEO Ciaran Connell and CTO Michael McLaughlin. The co-founders had a vision that the new IR-UWB technology, based on a nascent IEEE standard, could deliver ultra-accurate location in a way that would revolutionize people’s lives like GPS did in the 1990s.

Twelve years later, IR-UWB is on the verge of becoming the next essential component technology, like GPS, Wi-Fi and Bluetooth before it. Already shipping in millions of smartphones and cars, and across more than 40 other verticals, IR-UWB is enabling accurate indoor location services, secure communications, context aware user interfaces and advanced analytics.

“We are thrilled to announce the acquisition of Decawave by Qorvo,” said co-founder and CEO Ciaran Connell. “We have created an incredibly unique technology, but we understand that to embrace the opportunity in front of us, we will need greater resources to execute at scale, accelerate our innovation and product launches and to continue to support our growing customer base with the same level of service.

“Joining forces with Qorvo’s leading expertise in RF technology, their experience in serving very high-volume markets like Mobile but also the thousands of customers in Industrial and Enterprise, is, for Decawave, a perfect combination to scale and further accelerate the adoption of IR-UWB.”

Eric Creviston, President of Qorvo Mobile Products, said, “We’re very pleased to welcome the Decawave team, which we believe will enhance Qorvo’s product and technology leadership while expanding new opportunities in mobile, automotive and IoT. We look forward to building on the groundbreaking work that Decawave has done and helping to drive new applications and businesses using their unique UWB capability.”

Decawave co-founder Michael McLaughlin added, “From proving a new technology, to building new markets and to today joining a Tier 1 semiconductor company, the past 12 years have been a challenging and fantastic journey.

“None of this would have been possible without the dedication and passion of Decawave employees as well as the constant support from our lead investor Atlantic Bridge, Act Venture Capital, Summit Bridge, Enterprise Ireland and our business angels. To all others who accompanied us on this journey we also say a sincere and profound thank you and we look forward to the next chapter for IR-UWB.”

In the coming months and years Decawave and Qorvo will:

  • Continue to contribute to the IEEE, Car Connectivity Consortium, FiRa and UWB alliance to define next-generation PHYs and protocols, ensuring interoperability across applications and fueling IR-UWB adoption,
  • Accelerate the roadmap of ICs and modules, leveraging their respective R&D strengths and product portfolio to bring even more IR-UWB solutions to the market,
  • Pursue existing partnerships and investments in enablement to offer flexible and easy to integrate IR-UWB solutions to our customers.
Publicerad den Lämna en kommentar

Sapcorda releases high-precision GNSS service in USA and Europe

Sapcorda-logoSapcorda Services GmbH has released its SAPA (Safe And Precise Augmentation) Premium GNSS positioning service.

The SAPA service enables mass-market GNSS devices to operate with increased accuracy and reliability across Europe and the continental United States. The service’s technology unlocks advanced performance with instantaneous sub-decimeter position accuracy for devices used in all market applications.

SAPA is delivered using the open industry-recognized SPARTN format, which allows efficiently delivery of the correction data via internet and satellite broadcast. “When using our service, users across Europe and the United States can experience homogeneous, gap-free, advanced positioning performance with any GNSS hardware designed for high precision positioning,” CTO Rodrigo Leandro said.

The SAPA service is tailored for mass-market applications including innovative mobility solutions, IoT applications, and traditional markets such as maritime.

SAPA was designed from ground up to support safety-critical applications such as autonomous driving.

SPARTN (Safe Position Augmentation for Real-Time Navigation) is a high-accuracy, open- and free-to-use GNSS format tailored for broadcast distribution in mass-market applications.

Sapcorda Services GmbH is a GNSS service provider focusing on the emerging high-precision GNSS mass markets. The company has designed its technology and service offering to serve high volume automotive, industrial and consumer markets.

Publicerad den Lämna en kommentar

GPS problems bedevil Denver light rail

Denver’s RTD light-rail system has bragged that “RTD is one of the few transit agencies, nationally, to meet Congress’ original Dec. 31, 2015 deadline” for instituting Positive Train Control (PTC).

Yet reception of the GPS signals upon which their PTC system depend continues to be a significant problem.
PTC is designed to prevent train-to-train collisions, derailments caused by excessive train speed, train movements through misaligned track switches, and unauthorized train entry into work zones.

This means that the location, speed and time information derived from GPS are critical elements.

Photo: RTD

Photo: Regional Transportation District of Denver (RTD).

Lack of reliable GPS reception has meant significant reductions in the efficiency and performance of the light-rail system overall, and much more work for its operators. Coping mechanisms have included manual overrides of PTC safety features and human flaggers at “automated” crossings.

This has undoubtedly greatly increased operating costs, not to mention the price of attorneys to deal with regulatory issues and litigation.

The upshot of all of this is that Denver RTD continues to struggle to make its operational PTC system work.

This has been a concern for the Federal Railroad Administration (FRA), the agency within the Department of Transportation responsible for overseeing and regulating such systems.

In a December 2018 submission to the FRA, Denver’s RTD outlined the steps it was taking to address this problem. In the document and public statements, RTD has blamed high-rise buildings in the vicinity of lines and terminals for its GPS problems.

“Specifically at Denver Union Station, there has been significant high-rise building development in the surrounding area which has impacted reception of GPS signal (sic) in the platform area. There are a few PTC initialization issues each day due to poor reception of GPS signal (sic). This increases PTC sut outs for the first section of the train trip and in some cases cause a longer waiting time at York crossing once the train initializes at 38th/Blake station.”

One of the solutions to be evaluated in January 2019 was installation of GPS signal repeaters at the stations to improve reception at the platform.

This was likely not successful. In October 2019 RTD responded to a complaint on Twitter with ”We are in the middle of installing hardware on our light-rail trains so they will be able to use GPS also.”

When asked this week about the status of their GPS problems, RTD replied simply “We are still working on it.”

GPS expert and Colorado resident Logan Scott opines that high-rise interference might not be as problematic if we can learn how to safely use all of the GNSS signals available. “Depending on the time of day, there are from 5 to 12 healthy GPS satellites visible in the open sky over that city. If we include all healthy GNSS satellites, the numbers rise to between 22 and 35 navigation satellites visible. As the nation looks for backups and augmentations to GPS for critical applications, the possibility and benefits of using GNSS systems beyond GPS is often overlooked.”

Scott will be teaching a course titled “Towards the Safe Use of GNSS in Critical Applications” at June’s ION Joint Navigation Conference in Cincinnati.

Publicerad den Lämna en kommentar

Editorial Advisory Board PNT Q&A: Matching receivers and antennas

What are the key technical criteria in matching GNSS receivers and antennas from the same or different manufacturers? For what uses does it matter most?

Photo: Orolia/Spectracom

John Fischer

“For fixed-pattern antennas, it’s fairly simple: RF + DC to power the antenna. Most vendors are compatible. The challenge is more for controlled radiation pattern antennas (CRPA). Power requirements vary greatly, and performance can be improved with a two-way data exchange between the CRPA and receiver, but there is no industry standard yet for this interface. An example: tilt angles from the receiver’s IMU can greatly aid beam pointing.”
John Fischer
Orolia


Ellen Hall

Ellen Hall

“Antenna selection is exceptionally critical for our military and high-precision users. The platform and environment are the primary drivers of these antenna requirements. In general, SWaP (size, weight and power) is at the forefront of all criteria. As operational plans are developed, requirements for a single or multi-element array,  element gain, and noise figure must be considered.”
Ellen Hall
Spirent Federal Systems


Members of the EAB

Tony Agresta
Nearmap

Miguel Amor
Hexagon Positioning Intelligence

Thibault Bonnevie
SBG Systems

Alison Brown
NAVSYS Corporation

Ismael Colomina
GeoNumerics

Clem Driscoll
C.J. Driscoll & Associates

John Fischer
Orolia

Ellen Hall
Spirent Federal Systems

Jules McNeff
Overlook Systems Technologies, Inc.

Terry Moore
University of Nottingham

Bradford W. Parkinson
Stanford Center for Position, Navigation and Time

Jean-Marie Sleewaegen
Septentrio

Michael Swiek
GPS Alliance

Julian Thomas
Racelogic Ltd.

Greg Turetzky
Consultant