Publicerad den Lämna en kommentar

Nearmap unveils streaming 3D aerial imagery, AI technology

Aerial imagery business Nearmap has launched its new 3-D product to streamline the way industries such as urban planning, architecture, construction, government and councils view and shape cities across Australia and the U.S.

The company is also previewing its groundbreaking artificial intelligence (AI) technology at its customer event Navig8.

Nearmap 3-D allows customers to stream and export 3-D imagery on demand at massive scale through its proprietary MapBrowser web application. Because the imagery is updated frequently, businesses can work with the most current information to make more informed decisions.

Nearmap’s new AI technology is turning millions of aerial images — captured over a decade and multiple times a year — into valuable datasets. The datasets can be used to more accurately and efficiently measure change and quantify attributes, such as solar panels, pools, roofs or construction sites.

Organizations ranging from small businesses to large companies and cities will be able to take advantage of AI-driven location intelligence.

“Product innovation is in our DNA. Everything we do has the customer at the core,” said Tony Agresta, executive vice president of product at Nearmap. “Our customers’ worlds are evolving every day. We need to keep innovating to continue to give our customers a competitive advantage through technology breakthroughs like the ones we are sharing today at Navig8.

“Nearmap 3-D is the result of a significant investment in R&D, but also listening to our customers and what they need to transform the way they work,” Agresta said. “Accessing 3-D imagery up to now has typically been an arduous, time-consuming and expensive process — but not anymore. This represents the single largest, most frequently updated footprint of 3-D accessible through a browser. The ability to measure in 3-D space, size up an area and then export Nearmap 3-D for use in other platforms will transform the aerial imagery market.

“The AI technology that we’re working on will allow organizations to identify locations with specific attributes and in so doing, reduce site visits, generate more leads, and eliminate the time involved to inspect properties manually. Nearmap AI does the heavy lifting so you don’t have to,” Agresta said.

Composite aerial image of Perth, Australia. (Image: Nearmap)

Composite aerial image of Perth, Australia. (Image: Nearmap)

Instant access to 3-D through MapBrowser

Nearmap is making 3-D imagery accessible to anyone, in the same way it has with 2-D. While Nearmap has offered 3-D imagery since 2017, this new iteration of the technology allows users to instantly stream 3-D content at massive scale via its MapBrowser web application.

The lightweight platform offers customers an immersive 3-D experience, allowing them to visualize cities in 3-D from any direction, measure distances, and immediately export a custom area in a variety of 3-D formats at unprecedented speed — the download time is a matter of minutes for most requirements and only a few hours for very large footprints.

“It’s like switching from DVDs to streaming services,” said Tom Celinski, executive vice president of technology and engineering at Nearmap. “Our camera technologies have been capturing 3-D since 2017, but now our secret sauce is bringing it onto MapBrowser, allowing users to easily and instantly stream this content with many export options. Now users can visualize, measure, define a custom area, export our 3-D and use it in their workflows with other commercial platforms and tools. We’re helping 3-D experts and novices alike access reality like never before, and this is an important next step in our Reality as a Service journey.”

Nearmap 3-D comes with an extensive library, covering more than 400,000 square kilometers. It is updated once a year and covers major urban areas in Australia and the U.S.

“We live in a 3-D world, we think in 3-D, and so we have to ensure that our products give the closest representation of reality as possible,” Celinski said. “That means businesses that rely on visualizing 3-D content, like architects, for example, can now access up-to-date 3-D models instantly and export them in just minutes. In a tender process, for example, that can be the difference between winning a new project or not. The opportunities for Nearmap 3-D are endless.”

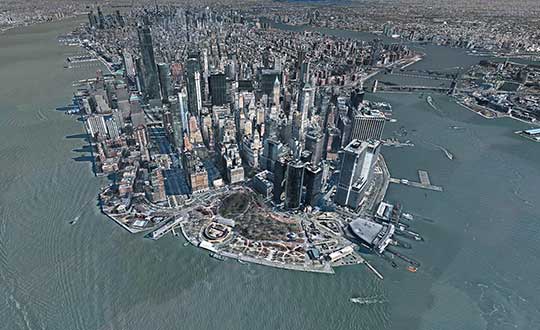
3D image of Manhattan. (Photo: Nearmap)

3D image of Manhattan. (Photo: Nearmap)

A living data set

Nearmap AI technology is the result of more than two years’ worth of research and development, and a team of close to 20 data scientists and machine learning engineers. The team, led by Dr. Michael Bewley, is using the petabytes of imagery that the business has captured over the past 10 years and turning it into a living dataset to accurately identify changes or quantify attributes from the Nearmap library of aerial imagery.

Nearmap has built highly accurate machine learning models and deployed them on a massive scale. The automated process, and the constantly learning engine, means that the AI technology can be applied to any new geography. Nearmap also applies the models to new surveys, generating fresh results with current imagery.

To date, Nearmap has performed analysis on over 1 million square kilometers of imagery across Australia and the U.S. (which constitutes about 80 million properties) and is performing more analysis every day. Nearmap is now inviting customers to take part in a beta program to experiment with various use cases.

“We don’t prescribe how our technologies or content can be used by our customers,” said Michael Bewley, director of AI systems at Nearmap. “Our solar customers could use the AI technology to easily identify where and when solar panels have been installed for maintenance jobs, to prospect new clients in an area where solar energy’s popularity is on the rise; or a government entity that previously had the arduous task of tracking swimming pools or construction in their jurisdictions will be able to do it automatically.”

“But this is the tip of the iceberg — we’re just getting started. This technology is going to profoundly change the way that cities are built,” Bewley said. “Our plans include delivering AI results in many forms, much the same way we deliver our imagery today.”

Both technologies will be presented at Nearmap’s flagship event, Navig8, in Perth on June 6, Melbourne on June 11 and Sydney on June 13.

Publicerad den Lämna en kommentar

China plans to complete BeiDou-3 by 2020

Photo: Xinhuanet

Photo: Xinhuanet

China is planning to complete its updated navigation constellation by 2020, according to China’s news service Xinhuanet.

Will 35 satellites, the completed BeiDou-3 will provide better coverage inside buildings and in urban canyons, according to researcher Jin Shuanggen, Shanghai Astronomical Observatory. Shuanggen was addressing the second Beidou Summit Forum.

China has deployed three systems, BDS-1, BDS-2 and BDS-3, to provide accurate positioning and navigation services to the world, said Jin Shuanggen, a researcher at the Chinese Academy of Sciences, at the second China (Nanjing) BeiDou Satellite Navigation Application Expo and Beidou Summit Forum.

The BDS system currently has 38 in-orbit satellites including 18 BDS-2 and 20 BDS-3.

“Traditional satellites navigation service is hardly available in the interior of buildings, underground, underwater and other locations. The BDS system provides better accuracy in these locations,” he said.

“BDS will play a large role as it is used in different scenarios including smart city, agriculture and meteorology, autopilot, and intelligent transportation,” said Jing Guifei, dean of BeiDou Belt and Road School of Beihang University.

Along with the summit, a three-day exposition displayed BeiDou applications with more than 400 exhibitors. Fields covered included drones, autonomous ships, surveying and mapping, and intelligent robots and vehicles.

Publicerad den Lämna en kommentar

DroneShield to collaborate with Collins Aerospace on anti-drone tech

Photo: DroneShield

DroneGun, part of the DroneShield anti-UAV system.(Photo: DroneShield)

DroneShield Ltd. and Collins Aerospace Systems, a unit of United Technologies, have entered a Memorandum of Understanding (MOU) to collaborate on opportunities with the Australian military, and globally.

The intent is to add DroneShield’s counter-drone capabilities to Collins’ surveillance systems that its customers are already using.

Collins Aerospace is a supplier of aerospace and defense products. In Australia, it holds current contracts within the Australian Defence Force.

DroneShield is a public Australian company whose products include a suite of counter-drone technologies capable of protecting bases and forward-deployed groups against enemy drone threats.

DroneShield’s products include DroneSentinel (a sensor fusion, multi-method drone detection system), DroneSentry (a combined detection and interdiction system), DroneGun Tactical (a handheld rifle-shaped drone-mitigation device) and RfPatrol (a body-worn drone detection device).

DroneShield Chief Executive Officer Oleg Vornik commented, “Collins Aerospace has a leading position in the Australian defence market and we’re pleased to work together on opportunities that complement our capabilities to enhance customer value.”

Updated Software.
 DroneShield has begun the rollout of firmware version 1.1 of its DroneShieldComplete software for its DroneSentinel and DroneSentry counter-drone systems.

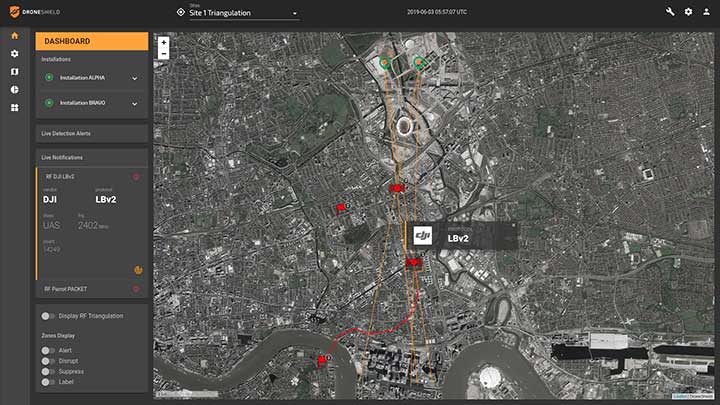
Enhancements include a number of features, such as pinpointing locations of pilots of detected drones. This allows for additional counterdrone procedures by customers, such as apprehending the pilots instead of neutralizing the drones directly.

This is expected to be of a substantial benefit for customers who are not legally able to deploy drone countermeasures, as well as enabling them to deal with the cause of the drone-related issues.

DroneShieldComplete 1.1 firmware, showing pilot detection capability with flags. (Photo: DroneShield Ltd.)

DroneShieldComplete 1.1 firmware, showing pilot detection capability with flags. (Photo: DroneShield Ltd.)

“The addition of the capability to locate and apprehend drone pilots without the need for taking down the drone has been developed in response to significant customer demand, and we expect this feature to be utilised by a number of our customers,” Vernik said.

Publicerad den Lämna en kommentar

How to use the NGS Beta GEOID18 web map

This column discusses the results of the National Geodetic Survey (NGS) beta hybrid Geoid18 model and the differences between the beta model and the official hybrid geoid model, Geoid12B. It provides examples to explain the symbology of the Beta Geoid18 Web Map. GEOID18 will be the last hybrid geoid model that NGS will create before NAVD 88 is replaced by the North American-Pacific Geopotential Datum of 2022 (NAPGD2022). I encourage users to access, investigate and become familiar with the web map.

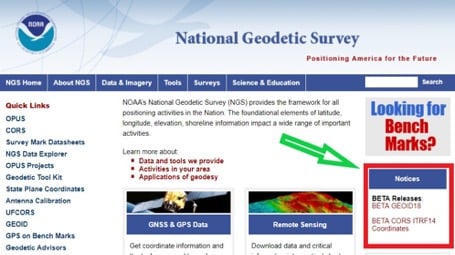
My last column included links to the NGS website that provides the beta coordinates and information about the latest Multi-Year CORS solution (MYCS 2). The column also noted that in late February 2019, NGS released a beta version of the latest hybrid geoid model. See Figure 1,National Geodetic Survey’s Home Web Page.” This column discusses the Beta Geoid18 Web Map, the results of the hybrid Geoid18 model, and the differences between the beta model and the official hybrid model, Geoid12B.

Figure 1. National Geodetic Survey’s Home Web Page. (Screenshot: National Geodetic Survey)

Figure 1. National Geodetic Survey’s Home Web Page. (Screenshot: National Geodetic Survey)

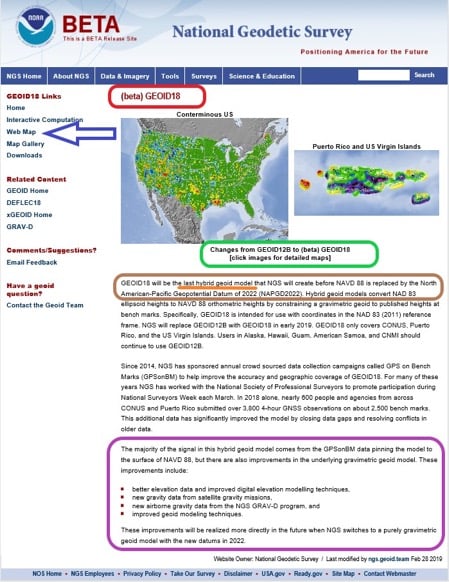
The Geoid18 hybrid geoid model can be accessed here. See Figure 2, Excerpt from Beta Geoid18 Website. The site provides an opportunity for users to compute a Beta Geoid18 value for a particular station. I would encourage all users to obtain an understanding of the new hybrid model. Once again, it should be noted that this model is a beta model for users to test their workflows and should never be used for official or production work. This allows users to identifies potential issues and differences between Geoid12B and Geoid18, and then contact NGS if they have a question. NGS has done a tremendous job of explaining the Geoid18 process and results, and would appreciate users helping to evaluate the new hybrid model. Several of my previous columns have highlighted the NGS GPS on Bench Marks (GPS on BMs) program and how users have supported the development of the hybrid Geoid18 model: Part 5, Part 6, Part 7, Part 8 and Part 9.

The NGS Beta Geoid18 website provides access to GIS tools that allow users to identify changes between Geoid12B and Geoid18 in their area of interest. The site also states that the hybrid geoid model, Geoid18, will be the last hybrid geoid model that will be created before the new geopotential datum, NAPGD2022, is adopted as the official datum. This is the opportunity for users to be involved in the analysis of the Beta hybrid geoid model. NGS will consider changes to the Beta model until it becomes an official published product. This hybrid geoid model is slightly different from the previous hybrid geoid model, Geoid12B. Similar to Geoid12B, the majority of the design of the hybrid model comes from the relationship between the NGS’ GNSS-derived ellipsoid-derived heights and the leveling- derived orthometric NAVD 88 heights. In other words, the hybrid model is designed to fit to the NAVD 88 orthometric heights.

That said, since the creation of hybrid Geoid12b, there have been improvements in the underlying gravimetric geoid model used in Geoid18. These improvements include:

  • Better elevation data and improved digital elevation modelling techniques,
  • New gravity data from satellite gravity missions,
  • New airborne gravity data from the NGS GRAV-D program, and
  • Improved geoid modeling techniques.

My previous columns have focused on procedures and routines for establishing GNSS-derived orthometric heights. As I’ve mentioned in these columns, there are many ways to analyze and investigate GNSS data and adjustment results. I have provided basic concepts that I believe are important for users to understand. My October 2016 column focused on the NGS “GPS on BMS (GPSBM)” dataset that was used to create the last hybrid geoid model, Geoid12B.

As mentioned in my October 2015 column, the hybrid geoid model is designed to fit the published NAVD 88 leveling-derived orthometric heights. I highlighted that the GPS on BMs dataset can be used to identify potential issues in the NAVD 88 published orthometric heights. The October 2016 column provided tools and routines that can be used to identify potential issues in NAVD 88 heights and/or NAD83 (2011) published ellipsoid heights. In support of the Beta Geoid18, NGS performed a detailed analysis of the GPS on BMs stations that were used in the creation of Geoid18.

Excerpt from Beta Geoid18 Website (Image: National Geodetic Survey)

Figure 2. Excerpt from Beta Geoid18 Website. (Image: National Geodetic Survey)

If you click on the “Web Map button” on the Geoid18 web page (see arrow in Figure 2), you may see the statement highlighted in Figure 3. Clicking on the link will redirect you to the correct web site (see Figure 4.).

Result of Clicking on Web Map Button

Figure 3. Result of Clicking on Web Map Button (Screenshot: National Geodetic Survey)

Web Map Option

Figure 4. Web Map Option – Results after clicking https://arcg.is/vSn8K (Top Level of Beta Geoid18 Map) [Screenshot: National Geographic, Esri, Garmin, HERE, UNEP-WCMC, USGS, NASA, ESA, METI, NRCAN, GEBCO, NOAA, increment P Corp. | National Oceanic and Atmospheric Administration (NOAA), National Ocean Service (NOS), National Geodetic Survey (NGS)]

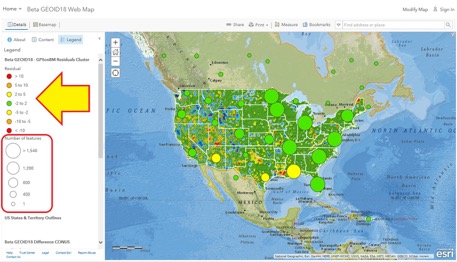
This data layer provides the value of the post-modeled residuals for all of the GPS on Bench Marks that were part of the evaluation of the Beta GEOID18 model. This Feature Layer is used to populate several layers in the Beta GEOID18 Web Map including the layers called Residuals and GPSonBM. The data for this web map can be found here.The top level of the Beta Geoid18 Map depicts a high-level picture of the residuals. The residuals are in centimeters and represented by different colors. The larger green and yellow circles represent the number of features in the region. The individual GPS on BMs station information appear as the user zooms down. There is a lot of information provided on the Web Map site. The legend changes to provide more detailed information as the user zooms down on the map. I have highlighted four sections on the legend in Figure 5 and provided an explanation of the layers below:

  • This data layer denotes whether the GPS on Bench Mark was used or rejected in the development of the Beta hybrid geoid GEOID18. The data for this web map can be found here.
  • This data layer denotes whether the GPS on Bench Mark was used or rejected in the development of the hybrid geoid GEOID12B. This has all of the same attributes as the spreadsheet provided on the NGS GEOID12B web page. More information can be found here.
  • This is a tile package that displays the difference between GEOID18 and GEOID12B in CONUS. It contains two overlayed raster files, one of which is the estimated error and the other is its hill shade. The data for this web map can be found here.
Legend of Beta Geoid18 Web Map

Figure 5. Legend of Beta Geoid18 Web Map(Screenshot: National Geodetic Survey)

Clicking on the “Content” link provides the data layers (see Figure 6). The user can turn these layers on and off depending on what they’re interested in analyzing.

Contents of Beta Geoid18 Web Map

Figure 6. Contents of Beta Geoid18 Web Map (Screenshot: National Geodetic Survey)

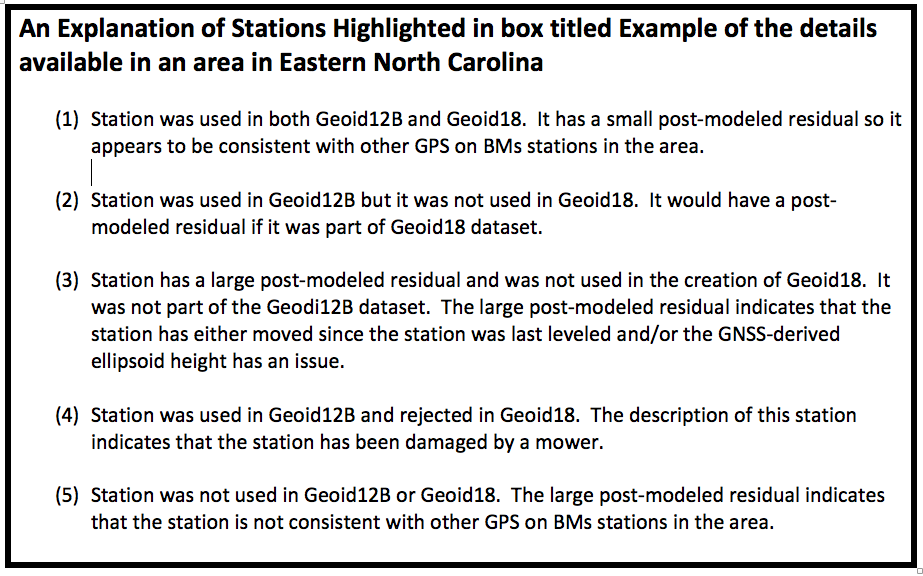
As previously stated, additional details are available as the user zooms into an area of interest (see Figure 7). Five stations have been highlighted in this figure to explain the symbology used on the Web Map site. See Figure 8 for these explanations.

Example of the details available in an area in Eastern North Carolina

Figure 7. Example of the details available in an area in Eastern North Carolina (Screenshot: National Geodetic Survey)

An Explanation of Stations Highlighted in box titled Example of the details available in an area in Eastern North Carolina

Figure 8. An Explanation of Stations Highlighted in box titled Example of the details available in an area in Eastern North Carolina (Screenshot: National Geodetic Survey)

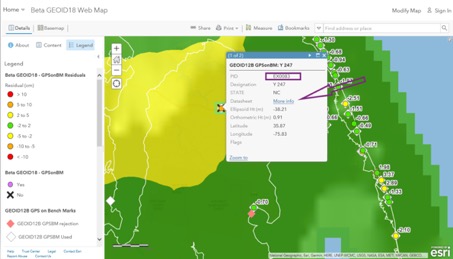
When the user clicks on a station’s icon, another window appears that provides specific information about that station. See Figure 9. If the user clicks on the “More Info” button, the routine retrieves the NGS datasheet from the NGSIDB (see Figure 10). As the NGS datasheet states at the end of the description for station Y 247, the station has been obliterated by a mower, which is why it probably was not used in Geoid18.

Example of Information Available for Individual Stations

Figure 9. Example of Information Available for Individual Stations (Screenshot: National Geodetic Survey)

NGS Datasheet for Station Y 247 (PID EX0083)

Figure 10. NGS Datasheet for Station Y 247 (PID EX0083) (Screenshot: National Geodetic Survey)


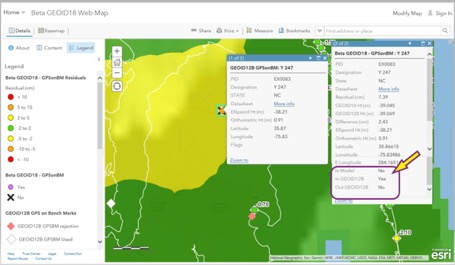
Figure 11
provides all the information available for station Y 247. It should be noted that the station was used in Geoid12B and not used in Geoid18. This means that there will be differences between Geoid12B and Geoid18 in areas where a station was used in Geoid12B but not used in Geoid18. The amount of the difference will depend on the size of the post-modeled residual. In this example, the post-model residual is 7.39 cm.

Example of Geoid18 Information Available for Station Y 247

Figure 11. Example of Geoid18 Information Available for Station Y 247 (Screenshot: National Geodetic Survey)

GPS on BMs data are usually based on different epochs of data; that is, the leveling data is usually observed at a different epoch than the GNSS data. This means, if the station has moved since the last time it was leveled, then the GNSS-derived ellipsoid height minus the leveling-derived orthometric height will not be equal to the geoid height. The procedure for computing GPS on BMs residuals was described in my February 2018 column. To determine if a bench mark had moved since it was last leveled, the analyst needs several nearby bench marks occupied by GNSS.Users have been very important to the development of Geoid18 by participating in NGS’ GPS on BMs program. These data have been used to improve the reliability of the hybrid geoid model. Users can now help by evaluating areas that have large changes between Geoid12B and Geoid18 (see box titled Figure 12). To help ensure that the appropriate stations were used to create the hybrid geoid model Geoid18, users could occupy nearby stations in the area to evaluate the reliability of the model. This will help NGS improve the reliability of the model in that region.

Example of a Large Difference Between Geoid12B and Geoid18 in Western North Carolina

Figure 12. Example of a Large Difference Between Geoid12B and Geoid18 in Western North Carolina (Screenshot: National Geodetic Survey)

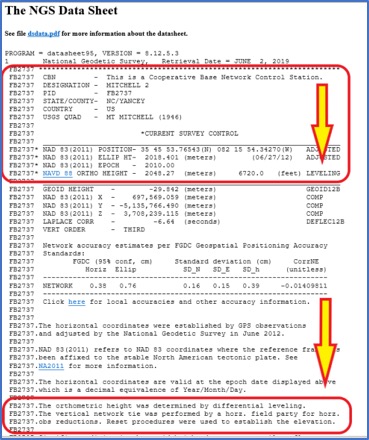
I described the NGS’ published height codes in my October 2016 column. In the case of Mitchell 2, there’s no leveling data in NGS’ database in the area surrounding Mitchell 2. There may be leveling projects that have been performed by other agencies such as the USGS but the leveling data have not been processed and loaded into NGS’ database. Users could help by performing GNSS observations on bench marks in the region that are in NGS’ database and/or by performing leveling observations between the GPS on BMs station and the nearest bench mark that has leveling data in NGS’ database.In the example of a large difference between Geoid12B and Geoid18 in Western North Carolina, station Mitchell 2 (PID FB2737) was used in Geoid12B but not used in Geoid18. It wasn’t used in Geoid18 because the NAVD 88 height was not based on an adjustment. According to the description, the leveling tie was performed by a field party that was performing a horizontal survey project (see Figure 13). The field party performed the appropriate leveling procedures but, in this case, the leveling data have not been placed in computer-readable form, so the orthometric height cannot be verified.

NGS Data Sheet for Station Michell 2 (PID FB2737)

Figure 13. NGS Data Sheet for Station Michell 2 (PID FB2737) (Screenshot: National Geodetic Survey)

I encourage users to access the web map and investigate stations that have large post-modeled residuals and/or stations that were used in Geoid12B but were not used in Geoid18. The NGS analyst rejected stations based on pre- and post-modeled residuals but many times there wasn’t enough redundant information available to ensure the station should be rejected or used in the creation of the hybrid geoid model. Users should be commended for their participation in the GPS on BMs program. Hopefully, users will continue their support by evaluating the beta hybrid geoid model.

Publicerad den Lämna en kommentar

Topcon launches rotary-wing UAV flight-planning software

Screenshot: Topcon

Screenshot: Topcon

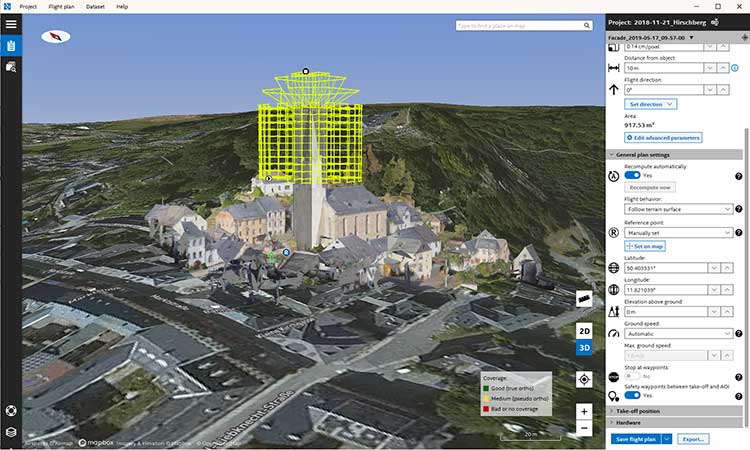
Topcon Positioning Group has released its next-generation flight-planning system for its rotary-wing aerial UAV offering.

The new Intel Mission Control Software is designed to facilitate automated flight planning, managing missions and data handling for the Intel Falcon 8+ drone – Topcon Edition and its available payload options.

The software is designed to increase accuracy with advanced mapping features that allow operators to easily set project parameters and prepare missions using presets for 2D areas such as polygon, corridor and city grid, as well as 3D structures like towers, buildings and facades.

“Operators can take advantage of 2D and 3D map views with the ability to import more precise project details and parameters, including restricted airspace, and support to adapt flight planning over difficult terrain,” said Charles Rihner, vice president of planning for Topcon Emerging Business.

“It features the ability to import elevation, KML, GeoTIFF and Shapefiles for real life visualizations targeted for accurate planning. Plus, expanded preset options support automated flight including circle of interest, panorama, and 2D and 3D missions with automatic elevation and terrain adoption,” Rihner said.

Additionally, the software includes automatic pre-flight safety and system checks while in mission planning. “Operators will receive detailed communication such as estimated battery life, airspace integration, ground and object safety limits, maximum dive and climb rate, minimum and maximum altitude, camera speed, number of images, camera storage, GSD check, and target photo coverage and quality,” Rihner said.

The flight-planning software is also designed to improve data handling and export to support easier data processing.

“It includes automated image matching and geotagging of images during data import, for increased time saving. Operators can preview and inspect the quality of the collected data, including individual images, as well as an overview of data coverage. Then, they can quickly and easily access and export flight data, and filter datasets for easier processing,” Rihner said.

Publicerad den Lämna en kommentar

Nepali survey team collects Everest height data

The survey team set up the base station in Everest base camp. (Photo: Tshiring Jangbu Sherpa via Nepal24hours.com)

The survey team set up the base station in Everest base camp. (Photo: Tshiring Jangbu Sherpa via Nepal24hours.com)

A Nepali survey team made a successful ascent of Mount Everest to measure its official height.

This is the first height survey conducted by the government of Nepal. The precise height of Mount Everest — now listed as 29,029 feet, or 8,848 meters — has been contested since the first survey by British officers in 1849.

Nepal plans to end the controversy and declare both snow and rock height of the world’s tallest mountain.

Chief Survey Officer Khimlal Gautam and surveyor Rabin Karki reached the peak of Mt. Everest on May 22 at 3 a.m. local time and collected data from a Trimble R10 GNSS receiver gifted from New Zealand.

The surveyors stayed atop the peak for about 1 hour, 16 minutes, according to Nepal24hours.com.

The final result of the official height measurement of Mt.Everest is expected within the next six months.

“To make the observation of data on GNSS we spent one hour and 16 minutes in the summit which was a very challenging and trying time for us,” Gautam said. “We faced extreme difficulty mainly while descending from the summit.”

According to Tshering Janbu Sherpa, guide leader of the survey team, the team faced difficulties because of the exhaustion of oxygen of one member, who was rescued during the descent.

Besides a GNSS survey at the summit, teams conducted precise leveling, trigonometric leveling and gravity surveys. The GNSS survey will cover 285 points with 12 different observation stations, nine of which are in hills of Sankhuwasava, Bhojpur and Solukhumbu districts.

Publicerad den Lämna en kommentar

USGS, scientists test drone-based river analysis

2019 Aquatic Airshow participants at Androscoggin River in Auburn, Maine, on May 1. (Photo: Mario Martin-Alciati, USGS)

2019 Aquatic Airshow participants at Androscoggin River in Auburn, Maine, on May 1. (Photo: Mario Martin-Alciati, USGS)

The U.S. Geological Survey (USGS) and independent scientists gathered this month in Auburn, Maine, to evaluate the use of sensor-mounted unmanned aircraft systems (UAS) to gauge stream stage, velocity, bathymetry and discharge.

The technology is being evaluated and modeled to determine whether it will support the fast, accurate and safe measurement of rivers, especially when they are flooded or contain floating trees, ice or other debris.

Close to two dozen hydrologic, geospatial and scientific experts gathered in what has been dubbed the “2019 Aquatic Airshow” to assess the technology. They were led by John Fulton of the USGS Colorado Water Science Center, Jack Eggleston of the USGS Water Mission Area Hydrologic Remote Sensing Branch, and Joe Adams and Sandy Brosnahan of the USGS National UAS Project Office.

The USGS Water Mission Area works with partners to monitor, assess, research and report on a wide range of water resources and conditions, including streamflow, groundwater, water quality, water use and water availability.

The testing involved equipping drones with noncontact sensors, including ground-penetrating radar for measuring river depths, doppler velocity radar and cameras with velocimetric analysis for measuring water surface velocities and calculating mean-channel velocities; and high-resolution cameras for photogrammetric mapping of surface topography and vegetation structure.

Team members from the USGS Water Science Centers in Colorado, New England and Virginia collected ground-truth river monitoring data with acoustic doppler current profilers deployed from a boat and multiple other surveying techniques to verify the accuracy of the drone-based stream data.

Woolpert Chief Scientist Qassim Abdullah was one of two scientists from the private sector asked to participate in the airshow. Abdullah has more than 40 years of experience in analytical photogrammetry, digital remote sensing, and civil and surveying engineering.

For the event, Abdullah devised a process in which the data collected by the drones underwent Pix4D triangular adjustment to produce three-dimensional models of the water surface and river edges to assist the modeling of river velocity using the drone-based doppler velocity radar and large-scale particle image velocimetry.

USGS scientists are in the process of evaluating the data and modeling produced by this testing to conclude whether this technology will prove beneficial.

Abdullah said the airshow was a success due to the varied contributions from each member of the team, their diverse backgrounds and their shared focus on water research.

“This was a great example of how a public-private partnership can work together to activate and elevate necessary, groundbreaking technologies to address worldwide issues,” Abdullah said. “Airshow team members brought different perspectives, processes and applications to the testing, which not only proved essential for this project but will help with many others moving forward. I love working with this group and look forward to continuing to help advance these vital technologies.

Publicerad den Lämna en kommentar

Antennas on the front line of anti-jamming

Protection from jamming has emerged as the key concern of of both national and organizational/corporate infrastructures. The world abounds in bad actors, and systems based on GNSS signals are uniquely vulnerable. A basic component of any anti-jamming (AJ) strategy is a shielded antenna. An upcoming webinar, June 27, gives a primer and several advanced looks at developing such an antenna-based AJ campaign. Register here for the complimentary webinar.

Anti-Jam antennas use techniques, such as nulling or beam-forming, to mitigate the effects of interfering signals. (Image: Orolia)

Anti-jam antennas use techniques, such as nulling or beam-forming, to mitigate the effects of interfering signals. (Image: Orolia)

Controlled reception-pattern antennas (CRPAs) are advanced, multi-element antenna solutions that protect a GNSS/GPS receiver from jamming sources. When combined with antenna electronics, they form an anti-jam antenna system (AJAS). These systems utilize several available technologies and vary in the number of elements.

CRPAs will play an increasing role in the GPS/GNSS landscape. Initially developed in the military domain, they are now entering the civilian market and are poised to bring their benefits to the fields of aerospace, ground transportation, autonomous driving and others. Engineers working with GNSS systems that employ CRPAs and multi-element antennas need special test systems since they need to replicate very specific test conditions that are impossible with live signals.

The June 27 webinar, “Advanced Simulation Test Systems for Controlled Reception Pattern Antennas,” will cover the basics of AJAS and CRPA, and the methods used to test them. Details on simulation system configurations, calibration techniques, and use case examples will also be presented.

These complex antenna systems require advanced GNSS simulation equipment in order to be designed and validated, as well as to test their performance. These test systems come in two forms — an anechoic chamber system used to test the CRPA antenna over the air, and a wavefront simulator used to test the antenna electronics with a direct cable connection.

Webinar speakers:

Photo: Spectracom

Perdue

Lisa Perdue, Product Manager, Orolia. Perdue is an expert in testing critical GPS and GNSS systems. She has trained hundreds of engineers and technicians who are responsible for high-reliability positioning, navigation and timing applications. She took a lead role in the development of the first GNSS Vulnerability Test System and speaks widely on the topic at many industry conferences.

Headshot: Stéphane Hamel

Hamel

Stéphane Hamel, Director, Testing, Orolia. With a career spanning more than 20 years in engineering test and RF, Hamel has developed many innovative and large-scale products to test semiconductor devices, radios and GNSS receivers. In 2014, he founded Skydel, now part of Orolia. Hamel is one of the architects behind the Skydel SDX GNSS simulator.

Dean Kemp, Defense Segment Manager, NovAtel.

Moderator: Alan Cameron, GPS World.

Register here for the free June 27 webinar.

Publicerad den Lämna en kommentar

Tell us the future: State of the Industry survey open for input

What technical and business challenges are getting your attention this year?

What are the most important benefits of, and the key challenges posed by, new modernized GNSS signals? How are you driving business in today’s economy?

What issues are you concerned about?  What solutions hold the most promise for positioning, navigation and timing (PNT) in challenged and indoor environments — regardless of which technology provides them?

We want to know, and so does the rest of the industry.

What is the key challenge for positioning and navigation in the wireless and consumer space? (Source: GPS World 2018 State of the GNSS Industry survey)

What is the key challenge for positioning and navigation in the wireless and consumer space? (Source: GPS World 2018 State of the GNSS Industry survey)

GPS World is asking PNT professionals about the developing technology frontiers, the state of their business, the economic climate for products and services, driving market factors, the effects of jamming, the Issue of the Year — and more! Please give us your opinions in the 2019 State of the Industry survey. It should take less than 10 minutes, and your responses are confidential.

A handful of lucky participants drawn at random will win TWO $100 gift cards good (virtually) anywhere.

Complete the survey by June 30. Then look for a complete report of our findings in the September issue of GPS World.

Thank you for taking the time to share your feedback and help us improve our magazine content, industry awareness — and your own business!

While asking questions that have appeared in past State of the Industry surveys, to reveal industry changes that have taken place over the last five years, the 2019 Survey presents these new issues for your consideration:

• With multiple constellations, signals and services now beginning to emerge, what are the challenges to keeping open and seamless access to these in the international marketplace ? 

• Among the many benefits of modernized signals, which is the most important in your field of work?

• Among the key challenges in utilizing modernized signals, which gets most of your attention? 

The question above offers such answer choices as: increases die size without ability to increase chip cost; longer code sequences are difficult to acquire; increases RAM/ROM; increases number of RF channels; increases number of digital channels; higher CPU processing required; and software complexity with many signal types. 

What one word would you use to describe your company’s No. 1 opportunity to grow in 2020? 

What one word would you use to describe your company’s No. 1 obstacle to growth in 2020?

Overall, the 2019 Survey covers such topics as:

  • Technology Trends.  PNT is rapidly diversifying among a number of complementary technologies, as GNSS looks to inertial, lidar, laser, cellular, WiFi and other beacons, signals of opportunity, low-Earth orbit satellite constellations and more. Different market sectors have, naturally, different requirements, and these lead to different integration combinations. Where do you see the most promise?
  • The Global Economy and how it affects business in your sector. Customers’ availability of capital to invest is top-of-mind for most industry professionals, whether designers, manufacturers, integrators, suppliers/dealers, or end users.
  • Industry Confidence in the road ahead. Sound business navigation requires a fluid, responsive combination of technology, capital, investment, and often most important, human capital. .
  • Issues of Concern. To what extent do industry leaders take into account the following as well as further factors?
    • Pricing and competitive issues;
    • GNSS jamming, spoofing, other RF interference;
    • Developing compatibility and interoperability of GNSS: GPS, GLONASS, BeiDou, Galileo;
    • Advantages and drawbacks of other positioning and navigation technologies.

The survey report, complete with insightful articles and infographics, will appear in the September issue. Look for it!

Please click here to begin the survey.

Publicerad den Lämna en kommentar

Robinson helicopter tested as UAV for heavy lifts

A Robinson R22 helicopter was converted by UAVOS to an unmanned drone. UAVOS — which specializes in the design, development and manufacturing of unmanned vehicles and autopilot systems — successfully completed in-air programmed missions with the unmanned helicopter.

The first flight this spring of the modernized helicopter lasted more than one hour and was performed in a fully self-piloted mode, reaching an altitude of up to 2,200 feet (670 meters). During the flight, all scheduled tests were performed including fully automatic take-off, enroute flight and landing. The tuning of UAV control settings was completed as well.

The converted R22-UV is serving as a platform for research and testing for commercial UAV options. For instance, upcoming test flights will include cargo delivery of up to 330 pounds (150 kg) in automatic mode. Flights with a duration of 6+ hours using additional fuel tanks and a payload for monitoring the land surface are also planned.

Besides that, UAVOS is planning to check operational limitations of the UAV during night flights and flights under severe weather conditions. A top priority is testing the possibility of using spraying equipment and to see whether R22-UV could serve agricultural purposes.

Components installed. The UAVOS components installed in R22-UV helicopter included autopilot, servo drives, sensor system and additional backup power supply. During the conversion, the aircraft electrical system was upgraded, manual control was removed, the fuselage was altered for servo drives and components of the automatic control system installation. In addition, the pilot seats were removed and replaced by additional fuel tanks.

Powered by a gasoline engine, the unmanned R22-UV helicopter is able to deliver cargo or carry payload with a total weight of up to 330 pounds (150 kg) with a maximum take-off weight of 1,400 pounds (635 kg).

Heavy payloads. The converted aircraft has a practical ceiling of 13,780 feet (4,200 meters) and has a top speed of 189 kph. The UAV is designed to carry high-precision, heavy professional equipment 88 pounds (40 kg and more) for a wide variety of missions including lidar, synthetic aperture radar, heavy optical equipment or gas analyzers.

The R22-UV can be operated in the regions without airfields, under severe weather conditions and during night-time, in the conditions with high stress risk for a pilot. The converted helicopter is useful for oil and gas companies that need to deliver cargo to hard-to-reach places, or where chemicals hazardous to humans are spread on the fields and forests. Operational limits for high-altitude flights and missions in heavy turbulence and high mountain regions should be defined after appropriate testing.

The project was carried out jointly with King Abdulaziz City for Science and Technology (KACST), a scientific government institution of the Kingdom of Saudi Arabia.